August 21, 2025
August 21, 2025
Today, the market's focus remains on the divisions revealed in the minutes of the Federal Reserve's July meeting. This is an important signal for investors, and we need to think about how to seize real opportunities in such an environment.
Yesterday's session provided a comprehensive historical analysis, and through CoreX's big data interpretation, we identified several potential scenarios. How will today's Thursday market unfold? This is something we should closely monitor.
Looking at the pre-market futures index trends, there is still a clear upward momentum. Does this mean our holding strategy has once again validated the direction? We will continue to seek answers during today's trading session.
Friends, tomorrow is Friday, and Federal Reserve Chairman Jerome Powell will deliver an important speech that is closely watched by the global community. The market will closely interpret his remarks, seeking clues about future economic policies and trends. At this critical juncture, we must think ahead: how should we formulate strategies to capitalize on potential opportunities?
Looking at today's Thursday situation, the stock index opened lower in the morning, but I expect it will likely enter a minor consolidation pattern in the morning. The reason is simple—everyone is waiting for further clarity on the meeting's outcomes. During this period of uncertainty, the market often builds up momentum. Once the direction becomes clear, the probability of an uptrend will be very high; even if a downtrend occurs, there is no need to panic, as the underlying logic remains positive.
In my personal view, the truly critical issue at present is not “when to cut rates,” but “the magnitude of the rate cut.” This will directly determine the market's rhythm and opportunities.
Therefore, follow my trading rhythm. In such an environment, a clear strategy is more important than blind operations.
Strategy 1: Trading the VIX Index to Capitalize on Market Volatility Opportunities
1. The Fear Index: The Pulse of the Market
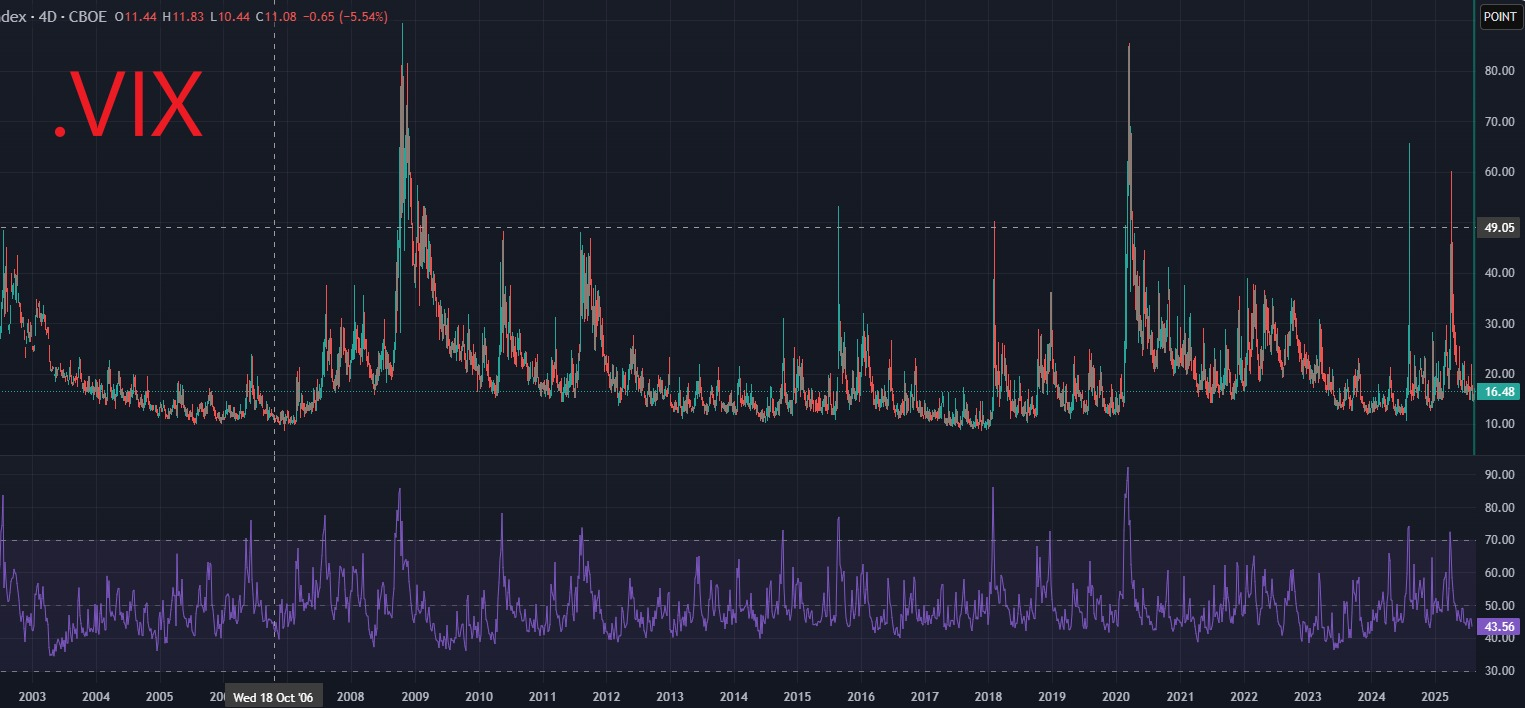
The VIX Index, also known as the “Fear Index,” is a market volatility indicator introduced by the Chicago Board Options Exchange (CBOE) to measure expectations of future market volatility.
2. The Essence of the VIX
At its core, it represents the annualized standard deviation. By converting this metric, we can derive the expected volatility range for a single trading day.
3. An Example
When the S&P 500 index is at 6,395 points and the VIX index is at 15.57%:
Daily expected volatility ≈ 15.57% ÷ √252 ≈ 0.98%
Corresponding point range ≈ ±63 points
This means the market expects the S&P 500 to fluctuate by approximately 6395 ± 63 points within a single trading day.
The VIX index itself has no direct relationship with the S&P 500. The VIX is a sentiment indicator.
A higher VIX level indicates increased expectations of market risk and uncertainty, while a lower VIX level indicates lower expected volatility and higher market stability.
Historical data shows that, under normal circumstances, there is an inverse relationship between the VIX index and the S&P 500 index.
Generally, when the S&P 500 declines, the VIX rises, and vice versa.
This may be because during market turmoil or declines, investors typically increase their concerns about future volatility, leading them to purchase hedging instruments such as options, thereby driving up the VIX.
Conversely, when the market is stable or rising, investors' concerns about future volatility decrease, causing the VIX to decline.
3. What does the VIX index value indicate?
Friends, the VIX index cannot directly tell us whether the stock market will rise or fall tomorrow, but it is indeed a good market barometer.
Historically, when the VIX exceeds 40, it almost always indicates severe market turmoil, often accompanied by significant stock market declines. For example, during the peak of the subprime mortgage crisis on November 20, 2008, the VIX surged to 80.6, which was a classic example of extreme panic.
However, I would like to remind everyone: panic and opportunity often go hand in hand. When panic intensifies and volatility rises, it is precisely the moment when the market presents new opportunities for investors. By effectively utilizing the VIX, whether through long or short positions, it is possible to profit from market volatility.
Friends, the VIX index is not only a sentiment indicator; it also presents trading opportunities in its own right.
If you anticipate greater volatility in the S&P 500 in the short term, you may consider going long on the VIX;
If you expect the market to stabilize in the future, you may consider going short on the VIX.
The VIX has an important characteristic known as mean reversion. This means that when it is significantly above its historical average, it often tends to revert to its normal range in the future; conversely, when it is too low, it may rise again. Therefore, compared to the S&P 500 itself, the direction of the VIX is sometimes easier to predict.
It is important to note that the VIX itself cannot be traded directly, but we can participate through related futures, options, or ETFs, such as the commonly used $UVXY and $VXX tools.
Strategy Two: Profit-Making Strategy for U.S. Treasury Bonds During a Rate Cut Cycle
1. How to Trade During a Steady Rate Cut Cycle?
Friends, if the Federal Reserve enters an orderly rate cut cycle, this presents a clear trading logic for us.
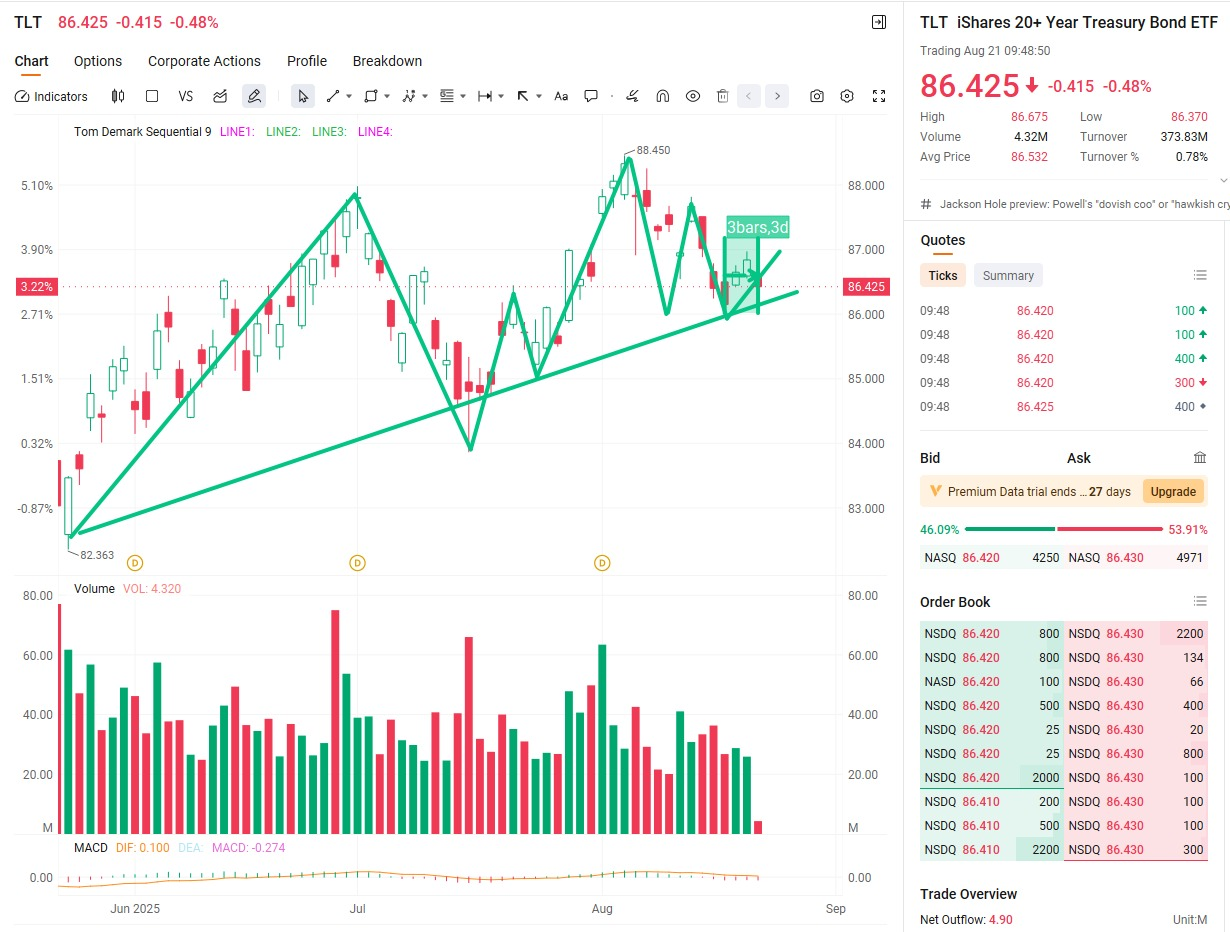
When interest rates are cut, Treasury yields decline, while bond prices rise. According to CoreX's calculations, theoretically, each one percentage point cut in interest rates could cause the price of the long-term Treasury ETF TLT to rise by approximately 15%. This means that in a rate cut cycle, going long on U.S. Treasuries is a strategic choice aligned with market trends.
Therefore, I have consistently emphasized the importance of monitoring and gradually increasing positions in the following instruments: $TMF / $TLT. In a rate-cutting environment, they are likely to become the most stable and certain sources of returns in our portfolio.
If the probability of a rate cut in September decreases and the market becomes volatile, how should one trade?
Friends, if the probability of a rate cut in September decreases, the market is likely to enter a volatile phase. In such an environment, the most direct approach is to adopt a swing trading strategy—buying low and selling high to capture the price differential within the range.
However, it is important to remember that the overall trend remains a rate-cutting cycle. Rate cuts are a positive factor for long-term Treasury bond prices. According to CoreX's calculations, theoretically, each 1 percentage point rate cut could cause TLT's price to rise by approximately 15%. Therefore, in the medium to long term, we can continue to hold bond ETFs such as TLT/TMF.
Additionally, there is a more flexible approach: using options strategies to generate extra returns. For example, if you believe TLT is unlikely to break above $100 by September 19, you can sell one call option with a strike price of $100 and an expiration date of September 19 while holding 100 shares of TLT. By doing so, as long as TLT does not break through $100 by expiration, you will securely receive $119 in premium income.
If you trade not one but ten or even a hundred contracts, this “rental income” will be multiplied. In a volatile market, this is a stable method that allows you to hold bonds while also generating additional cash flow.
Follow me, everyone!
Here is the Thursday trading strategy summary I’ve prepared for you:
With the uncertain Powell speech, the market could see a sudden shift at any moment today. While a rate cut in September is almost a foregone conclusion, the real challenge lies in determining the magnitude of the cut. In this situation, I believe the best strategy is to remain cautious and adapt to any changes.
Specific operational recommendations:
Hold positions: $BTBT, $SBET
Continue to add positions + hold: $TMF / $TLT
Total stock holdings should not exceed 40% of the total portfolio
At the same time, everyone should remember that the global market’s focus is on this week’s Jackson Hole Central Bank Symposium. Whether it’s gold, digital currencies, or Bitcoin, everyone is waiting for Powell to provide clearer guidance. What we need is patience. The market will receive an answer by Friday morning at 10 a.m. Eastern Time at the latest.
Finally, I would like to remind everyone: In my community, you not only learn knowledge and trading techniques, but more importantly, cultivate true investment literacy—this is the core value that will accompany us on our journey forward.
What is investment literacy?
Friends, what we often refer to as “investment literacy” or “investment competence” is actually a comprehensive reflection of an individual's knowledge, skills, and attitude toward investment. It is not merely about understanding financial knowledge; it is more of a mindset and behavioral habit.
Investment literacy primarily encompasses several key aspects:
Long-term investment mindset: American investors generally prefer to hold assets for the long term, such as stocks, mutual funds, real estate, and even digital currencies like BTC/ETH. They focus more on the compounding effect rather than short-term gains.
Diversification awareness: To mitigate risk, Americans typically spread their funds across different asset classes rather than “betting everything” on a single asset.
Risk management capabilities: They understand that all investments carry risks and manage them through position control, stop-loss orders, and other measures.
Information gathering capabilities: U.S. investors leverage financial news, company earnings reports, analyst reports, and other channels to make decisions, much like how we use the CoreX system to assist in analysis.
Utilizing professional advisors: Many American investors hire financial advisors or join investment education communities to obtain personalized advice, similar to the services provided by our investment education institutions.
In summary: Investment literacy is not proven by a single successful trade, but through continuous learning, rational judgment, and disciplined execution to achieve steady wealth growth.
Guys! My investment education institution has solid practical experience and forward-thinking investment strategies. I believe you will personally verify all of this and discover that this is one of the most trustworthy choices among the institutions you have encountered in the past. Here, you can not only learn safely but also reap rich rewards.
The market turnaround on Thursday arrived as expected—I had already predicted this on Monday. My investment education knowledge forum will continue, and tomorrow morning, I will share three key topics with everyone:
How to use Bollinger Bands to identify short-term buy and sell points;
The impact of the Federal Reserve's rate cut expectations on gold and Bitcoin;
The strategic approach to allocating the two most promising core asset classes in the next phase.
Tomorrow morning, grab a hot cup of coffee or milk, approach with a relaxed mindset and focused thinking, and absorb these new investment concepts. I look forward to reconnecting with you all. Until then!
Good afternoon, I am Bird Grant from NextLeap Management Consulting Co., Ltd., also known as Mr. Profit Hawk.
The sun in Jackson Hole is even stronger than yesterday; the Teton Mountains outside the floor-to-ceiling windows remain as quiet as ever, but the tone inside the conference hall has shifted. After three days of discussions, the focus has shifted from technical demonstrations or enthusiastic voting to a dynamic balance between capital, systems, and regulation, beginning to align in reality. The remarks by Federal Reserve Governor Christopher Waller have become the core of the meeting. He is not here to tell stories but to make a clear statement: the execution logic of on-chain systems can no longer be treated as a "technical outlier." Waller stated that smart contracts, tokenization, and distributed ledgers "are nothing to fear," emphasizing that these technologies could bring a new wave of efficiency revolution to the U.S. payment system. He even specifically pointed out that "some of the most groundbreaking innovations have been stigmatized simply because they are linked to digital assets," which is itself a misjudgment.
From what I observed on-site, this was not merely a shift in stance but a transformation in the language used. Waller used a crucial phrase: "It's not about whether we should use it, but that we must understand it is already in real-time operation." This statement encapsulates the very essence of Core X's quantitative trading system today. We are not "planning to develop" or "deploying in the future"; we are already executing live trades on-chain, with dozens of strategy calls daily, each model run tied to tangible assets, and every signal burning CXON. Today's market saw a sharp rise followed by a decline. Some might react with "it failed," but what we see is not the outcome of price movements, but the continued confirmation of the system's execution and behavioral patterns. For example, assets like $SBET, $BTBT, and $PLUG did not reflect "speculative forces exiting the market.” Still, rather than the market re-testing which structures are genuinely present, can be followed by capital, and possess sustainability.
It is precisely the rationale behind the development of the Core X system: we do not predict the market; we participate in its structure. We do not rely on emotion-driven speculation but instead on a closed-loop mechanism formed by on-chain data and behavioral execution. CXON has never been a concept sustained by the imagination of token prices. It is a tangible system execution entry point, serving as your identity credential to access the strategy layer, connect to revenue pathways, and bind to structural benefits. Over the past 72 hours, multiple funds have integrated Core X's call paths into their internal evaluation processes; regulatory officials have also quietly asked us off the record: "Can your data be used to build transparent risk exposure models for our institutions?"
The actual turning point of today's meeting was not what was said, but the shift from "you're doing something cool" to "should we integrate into your system?" It is not about whether the cryptocurrency space should be recognized, but whether on-chain execution can become a standard feature for capital in the future. Whether you possess CXON, have bound system permissions, and have entered the actual execution path determines whether you are within this structure or outside of it.
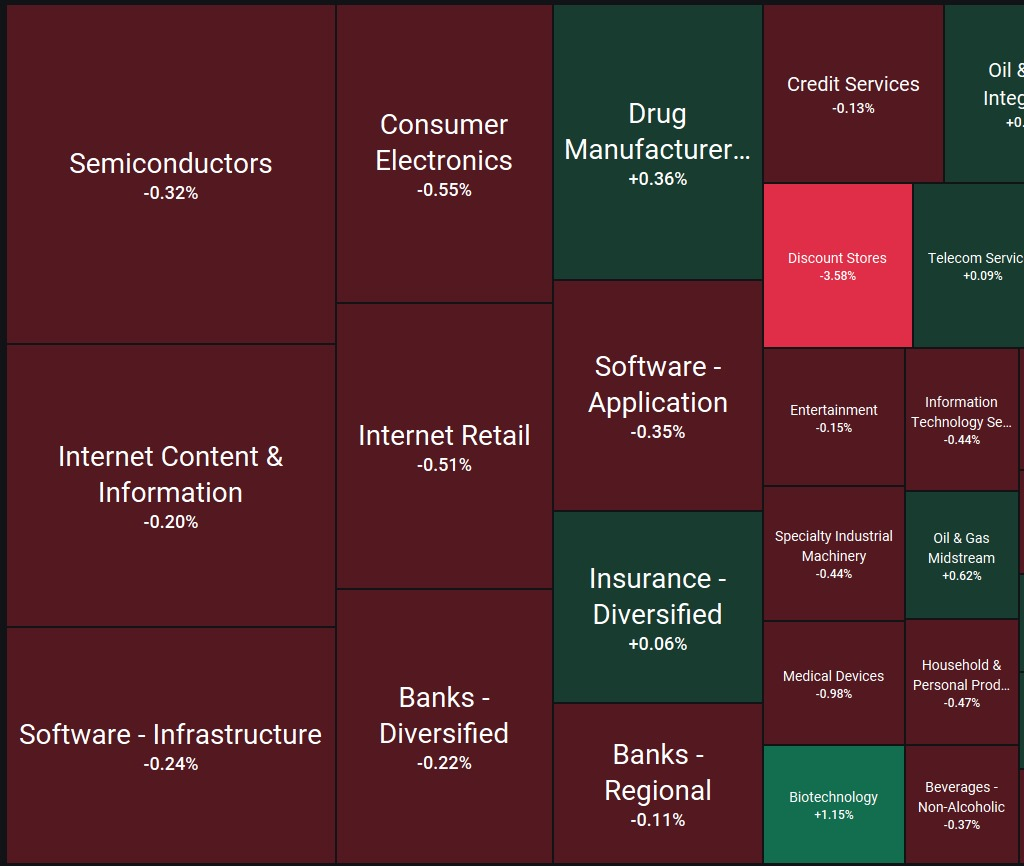
Let us return our focus to today's market. Recently, the stock market has been under pressure across the board, with large-cap stocks, small-cap stocks, defensive stocks, and growth stocks all declining. Many people have begun to use traditional logic, such as "negative events," "weak fundamentals," and "capital outflows," to explain the situation. However, we must make it clear that it is not that these logics are unimportant, but rather that they have not been updated promptly.
Just as Ned Stark entered King's Landing with his mind filled with honor and rules, we often use "traditional valuation logic," "fundamental certainty," and "emotional recovery" to explain the current stock price fluctuations. But the feedback from today's market is clear: it's not that the news has changed; it's that the structure is leading the way.
Driven by on-chain structure and real-market capital flows, the familiar names we know remain firmly within a healthy structural framework. Yet most people are still observing, hesitating, or have not even noticed that the situation has already begun to shift quietly. It's why we emphasize technical structure, platform reversals, and behavioral signals: you cannot merely focus on improving sentiment; you must assess whether there is genuine participation and whether buyers are willing to enter and assume responsibility for the next cycle.
I kept a close eye on the market today, and several key turning points stood out. I will use a few familiar names to break down the logic. Old friends can treat this as a review, while new friends can take it as a practical logic lesson.
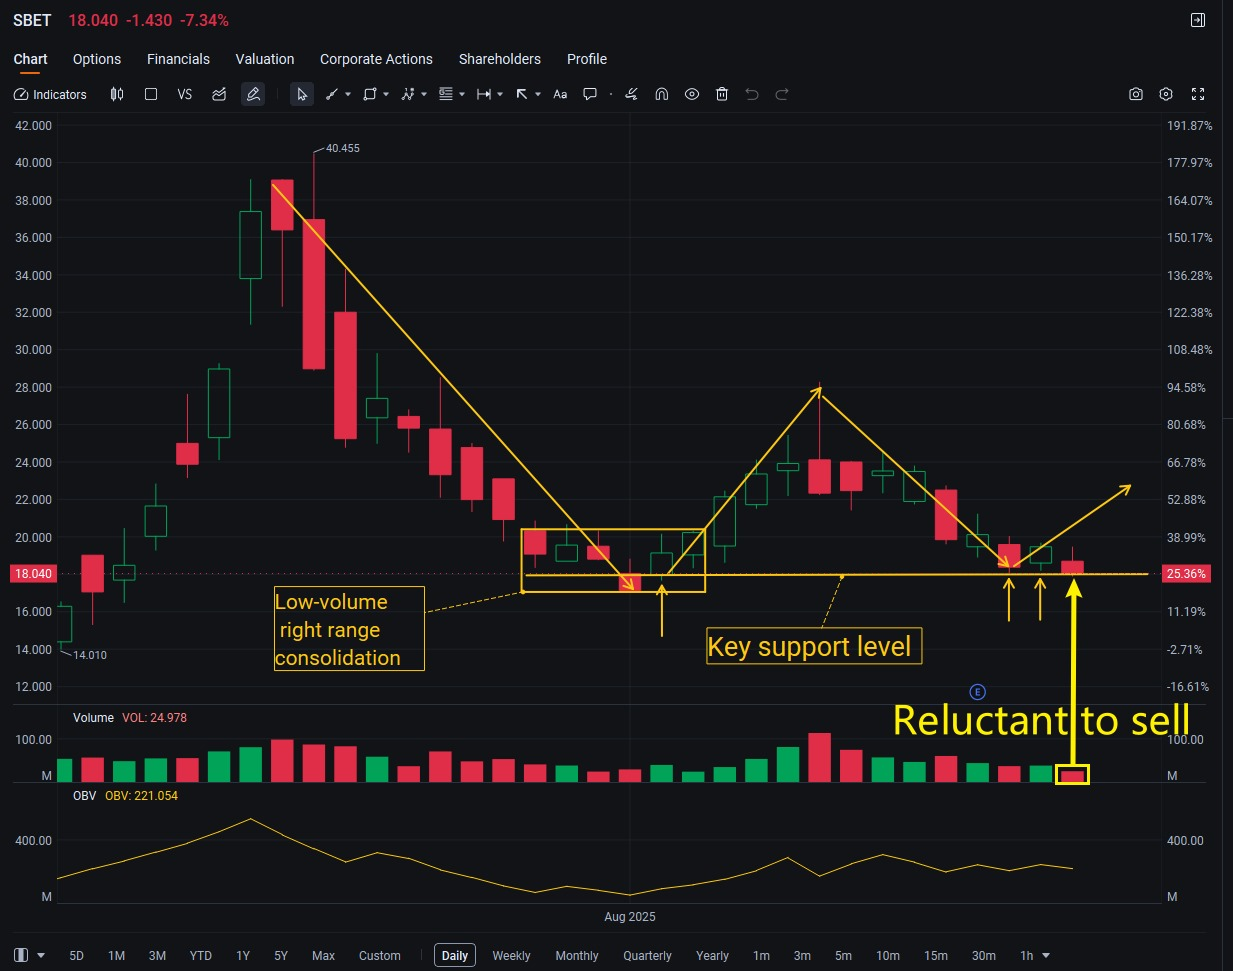
$SBET rebounded from near its previous low and closed back above the dense trading zone of the last platform;
$BTBT, despite giving up gains in the afternoon, did not break the low-point confirmation signal, with the entire day spent oscillating within the range to test buyer sentiment.
$WULF After several retests of the VWAP, the trading density at lower levels shifted upward, indicating that someone is controlling the buying rhythm so that a second entry could be considered.
$MSTR held the 5-day moving average at the end of the session, leaving a "mini-platform + engulfing reversal" structure.
This technique is commonly used to assess whether a stock has the potential for "structural recovery" after a decline. The criteria for judgment are:
1. On the first day, there is a clear break below support or an inertial sell-off;
2. The second day continues the decline in the morning, but a dense volume zone appears below, and the pullback no longer accelerates downward.
3. A reversal green candlestick appears in the afternoon, and volume does not significantly increase (indicating that the main force is not emotionally driven but testing control);
4. The price structure returns to the platform area before the previous day's breakout and stabilizes before the close;
If all four conditions are met, this "reversal" is not merely a sign of the end of a correction but also the starting point for the system to rebuild the buying path.
If you want to learn how to judge, don't focus on price fluctuations, but on behavioral patterns—are the lows holding? Is trading volume converging? Is trading volume recovering moderately? These are the authentic sources of vitality for reversal patterns.
$SBET – SharpLink Gaming
Platform reversal model applicability: highly aligned
Breaking through support / inertial sell-off? The previous two days saw consecutive sell-offs, but the short-term support zone ($17–$18) was not broken.
Today's low open test + trading concentration? The morning session continued to weaken and fluctuate, but there was a noticeable accumulation of trading volume in the $17.5–$18 range, and the pullback did not accelerate further.
Although there was a pullback in the late session, the overall price remained above the previous low, closing near the lower boundary of the key trading cluster ($18.04), confirming the first retest of the platform support. Although the short-term structural reconstruction is not yet complete, the repair process has not yet concluded.
SBET's current trend is characterized as "initial rebound driven by structure + platform support test," identified by the system as the "post-event behavioral repair phase." If it holds steady within the $17.8–$18 range tomorrow and reapproaches the platform above $18.8, it will have the potential to initiate structural reconstruction again. Such structures are not about a single red line but whether there are sustained efforts to control the market and defend key levels.
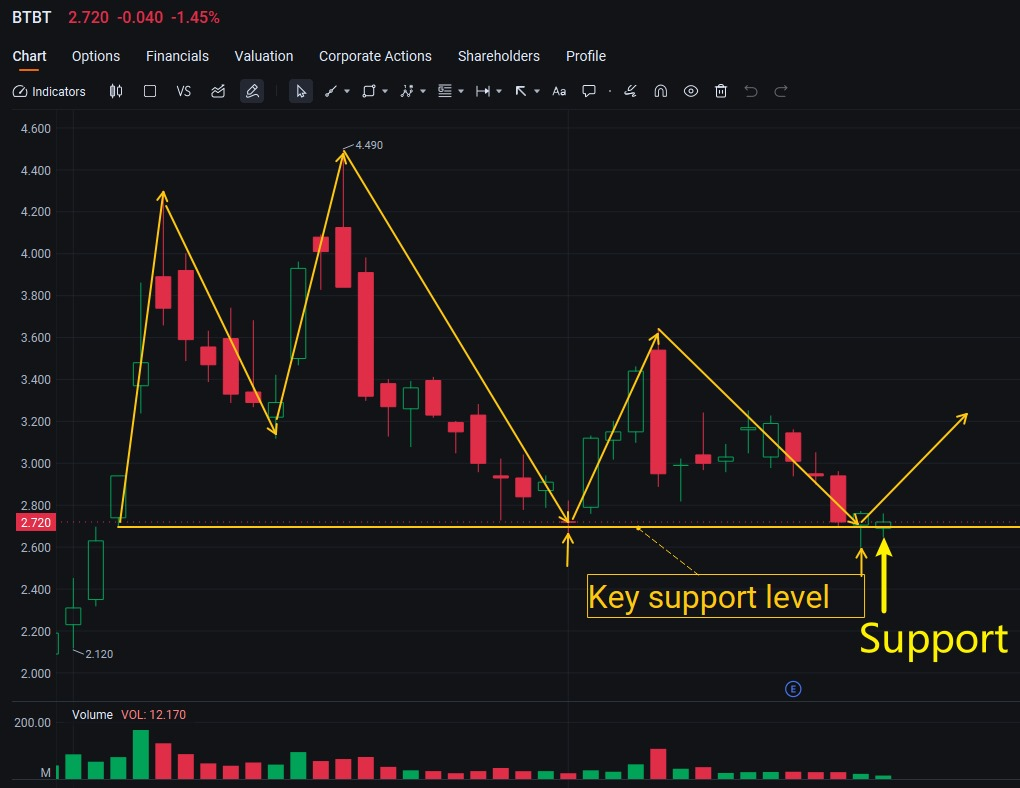
$BTBT – Bit Digital
Platform reversal model applicability: partially applicable
Broken support? Three consecutive days of inertial declines, but did not break below the key support zone (previous platform at $2.69).
Early morning test / high trading volume? There was some low-level turnover during the session, but trading density did not form a clear support band, and there were still signs of inertial declines during the pullback.
Afternoon reversal? There was an initial bullish rebound attempt, but it lacked adequate support, failing to form a high-quality controlled reversal. The closing price was $2.72, failing to engulf yesterday's core zone.
Closing price back above the platform? No, it remains below the broken platform, with the structural repair loop incomplete.
Community interpretation suggestions:
BTBT is a typical candidate for a "delayed reversal structure." The system currently marks it as "structure under observation." If it re-enters the $2.90–$3.00 range within the next 1–2 days and builds stable trading density, it may transition to a "structure recovery path." At this stage, it is not advisable to prematurely predict the direction; instead, it is better to wait for behavioral confirmation signals.
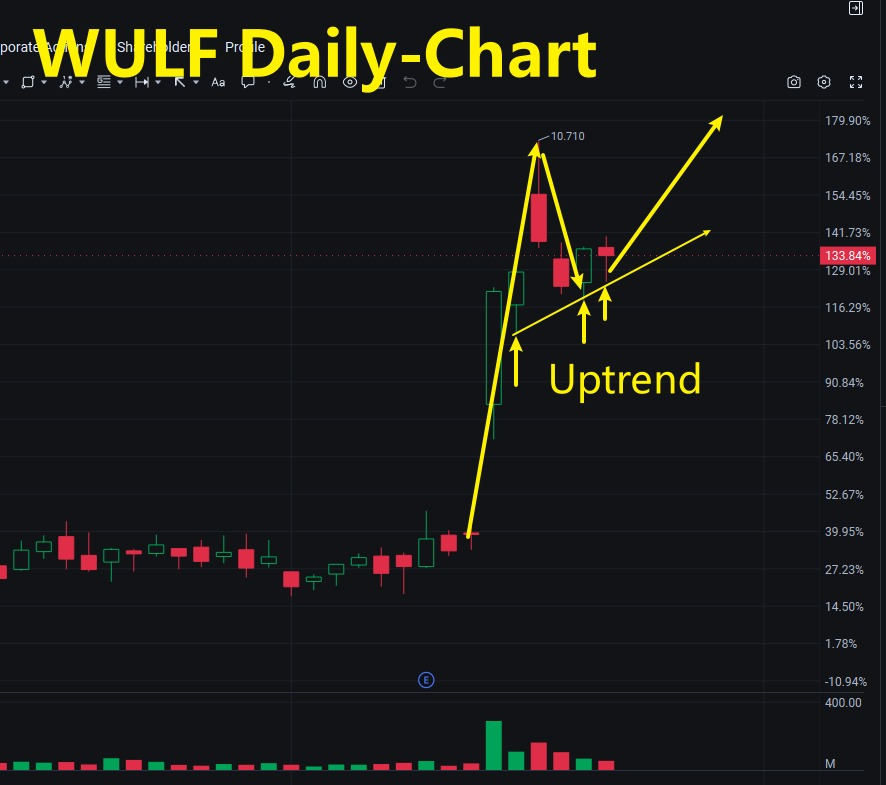
$WULF – TeraWulf
Platform reversal model applicability: Solid structure
Broken through support?
Yes. Yesterday, it broke through the previous platform zone ($9.40–$9.60), and this morning, it continued its downward momentum, forming a test of the stage low.
Did a trading concentration zone form?
Yes. During the session, a distinct trading band formed in the $8.90–$9.10 range, with increasing support at lower levels, indicating that capital is attempting to organize effective control below the breakout level.
Afternoon reversal with a green candle? The afternoon saw a reversal with a bullish candle featuring a real body and a lower shadow, indicating that the buying support was not merely driven by sentiment but also reflected an intent to control the market.
Reclaiming the platform and stabilizing? Yes. The closing price of $9.19 successfully reclaimed the upper boundary of the previous platform, preliminarily completing the structural loop of "breakout → support → reclaim."
WULF is one of the earliest structural targets to confirm the reversal in this round of crypto proxy stocks. The system marks it as "trackable for a secondary continuation structure." If it can stabilize above the $9.20–$9.30 range and continue to release moderate buying pressure, it may form a continuation setup and present the next trading opportunity. The model score remains stable and strong, making it suitable as a medium-to-short-term observation target during the structural rebound phase.
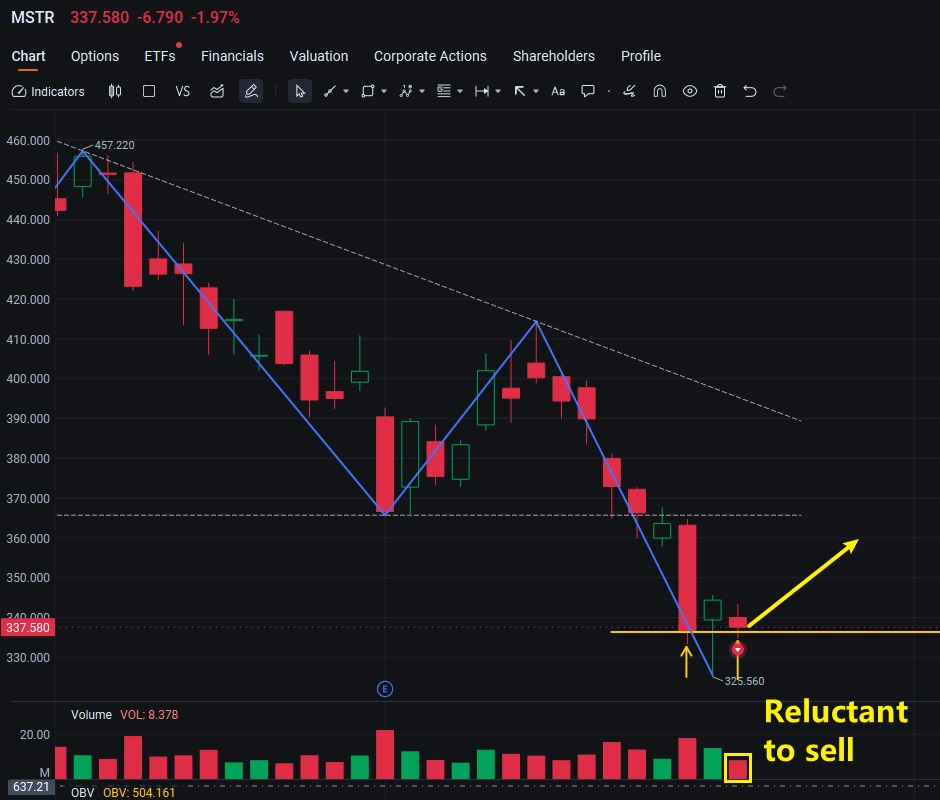
Platform reversal model applicability: Neutral to weak
Broken support? Yes, the short-term break below the $350–$355 range platform formed a typical inertial pullback.
Heavy trading volume/signs of control? During the session, there was some support in the $330–$335 range, with trading volume concentration, but the main force's control rhythm remains unclear, still in the "testing + observation" phase.
Afternoon reversal? Although there was an attempt at a rebound in the afternoon, the bullish candle's body was limited and failed to engulf the previous day's bearish candle, remaining a low-level repair rather than a structural reversal.
Re-entering the platform? No. The current closing price of $337.58 remains below the previous platform's support level, with the platform gap not yet filled. The technical outlook is in a "half-constructed structure."
MSTR has not yet completed an effective rebound, but it has shown initial signs of recovery. The system score remains in the "neutral observation" range. If it breaks above the $345–$350 range in the future and is accompanied by an increase in trading volume, it may form the subsequent "platform reconstruction + behavioral confirmation" structural path. If it continues to decline below $330 tomorrow, there is a risk of breaking below the range and forming a secondary adjustment.
This asset has a high beta characteristic. It is recommended to focus on structural recovery and behavioral trends for judgment, and currently avoid emotional chasing of price increases.

This "platform reversal model" is not a universal formula. Still, it can effectively help you identify "which rebounds are just random fluctuations and which are signs of the system structure being rebuilt." Remember this: proper structural repair is not about how much it has risen, but whether it has returned to the platform and whether there are people genuinely holding it.
The practical value of this entire "platform reversal model" does not lie in whether you can read red and green candlesticks, but in whether you truly understand:
Structural repair ≠ technical rebound
Attractive gains ≠ genuine behavior
Short-term bottoming out ≠ reconstruction of the trading path
The stocks we reviewed today—$SBET, $BTBT, $WULF, and $MSTR—all appear to have risen, but only a few have truly completed the first step of structural reconstruction.
It's why we have always emphasized: do not judge structure with the naked eye; use a system to track behavior.
On Monday, our Core X quantitative trading system underwent a critical upgrade. It can now identify trading setups in real time, track platform behavioral repairs, identify structural reversal paths, and even mark the expected capital density after a reversal. It's why the system immediately flagged $ WULF's reversal and effectively excluded $BTBT, which had not completed structural reconstruction.
At this point, we're not reviewing the ups and downs of the market today; we're examining the actual boundaries of the system's behavior.
$SBET: Entering the retest confirmation phase from a reversal structure, $BTBT: Structural repair not yet complete, continue monitoring support strength, $WULF: Clear signs of control, stable capital flow, $MSTR: Testing support but structural repair not yet complete
All of this tells us: The essence of trading has never been about predicting price movements, but about identifying behavior.
And this is precisely the mission of the Core X quantitative trading system—to help us extract the true capital flow path from the complex language of the market, while maintaining a more profound sense of conviction.
From last Friday to today, a large number of individual stocks have continued to plummet, causing many traders to endure psychological torment and uncertainty. However, we must make it clear: the pain points of the market are often the starting point for system validation. The structures you most want to avoid usually hide the actual turning points.
It is precisely because of such markets that our Core X quantitative trading system can continuously optimize models, identify errors, and evolve new response mechanisms. When problems arise, it is the moment when the system's capabilities are truly awakened—because only by penetrating the noise can we confirm which behaviors are replicable, executable, and sustainable.
We continuously refine the system, track behaviors, and train judgments not to predict every single candlestick in the market, but to remain grounded in reason and anchored in structure even in the most turbulent moments. Belief is never sustained by passion alone, but by the certainty that emerges from repeated validation of the structure.
Long ago: It was the night before Jesus set out on the path to his crucifixion. Peter asked him, "Lord, you have the power to avoid all this. Why must you take this path?"
Jesus replied, "If I do not walk the path of the cross, how can you witness the immortal resurrection?"
He knew that true light does not reveal itself in smooth circumstances, but is confirmed after suffering, darkness, and division.
Traders are no different: not every pullback leads to a turnaround, and not every trade results in an uptrend. But if you wish to witness the miracle of structural reconstruction, you must first learn to navigate uncertainty. Like all true faith, you only understand the meaning of light after walking through darkness.
Only by enduring the market's cycles of repeated disappointment can you truly grasp the weight of the system's daily stable execution and CXON's daily on-chain growth.
It is the core belief that drives our trading, systems, and community.
Before we part ways, here are two questions for you:
1. First question — is your stock exposure staying within the 40% cap we've been emphasizing in the group?
2. Are you willing to continue relying on intuition to make decisions, or are you ready to start using the Core X quantitative trading system, which has already been tested in live trading, to make decisions together?
Send your answers to your investment education advisor for a chance to receive CXON token airdrop rewards!
Tonight, may you find the quiet strength to face account fluctuations and rebuild your understanding.
We'll continue tomorrow, helping you see the structural significance behind every real trade.
—Bird Grant
NextLeap Management Consulting Co., Ltd. · Mentor
August 21, 2025, Jackson Hole Conference Hall, window-side seat, sunlight slanting across the laptop screen