August 25, 2025
August 25, 2025
I am Blake Shaw, and I am delighted to be back with you all in the NextLeap investor education classroom. Today, I will discuss three key terms that are currently influencing market trends: interest rate cuts, inflation, and tariffs.
Expectations for interest rate cuts are growing, providing more room for risk assets; while inflationary pressures persist, there are signs of weak stabilization, with next week's PCE data set to be a key test; and the uncertainty surrounding tariffs reminds us to avoid sensitive sectors and shift toward more certain directions.
Investing is not about fixating on the market, but about understanding its logic and structure. Today, I will provide a detailed analysis of how these three factors influence our investment strategies.
I have been tracking the data analysis of the CoreX quantitative trading system. As an AI-driven tool, it is not influenced by emotions or noise, but rather uses massive data and model simulations to reveal trends and capital flows.
It tells us:
The probability of a rate cut exceeds 80%, and the market has already priced this in;
Inflation remains stable, but core pressures persist, and next week's PCE data will be critical;
Tariff policy uncertainty is mounting, putting pressure on valuations in certain sectors.
In other words, the data is reminding us—the market rhythm is being redefined by these three key variables.
Today, I would like to share a basic strategy that I frequently utilize: the Alpha & Beta Stock Strategy.
This strategy is one of the most commonly used basic strategies: the Alpha & Beta Stock Strategy. Every stock has its unique trend and volatility.
Alpha/α represents the long-term trend, while Beta/β represents volatility.
Stocks with good medium-to-long-term trends and excellent volatility are those with both excellent α and β, such as $NVDA, which I shared in early July.
The approach for such stocks is straightforward: I use a separate account to trade them, essentially going all-in. Half of the funds are allocated for medium-to-long-term holding, while the other half is used to capture short-term price differentials.
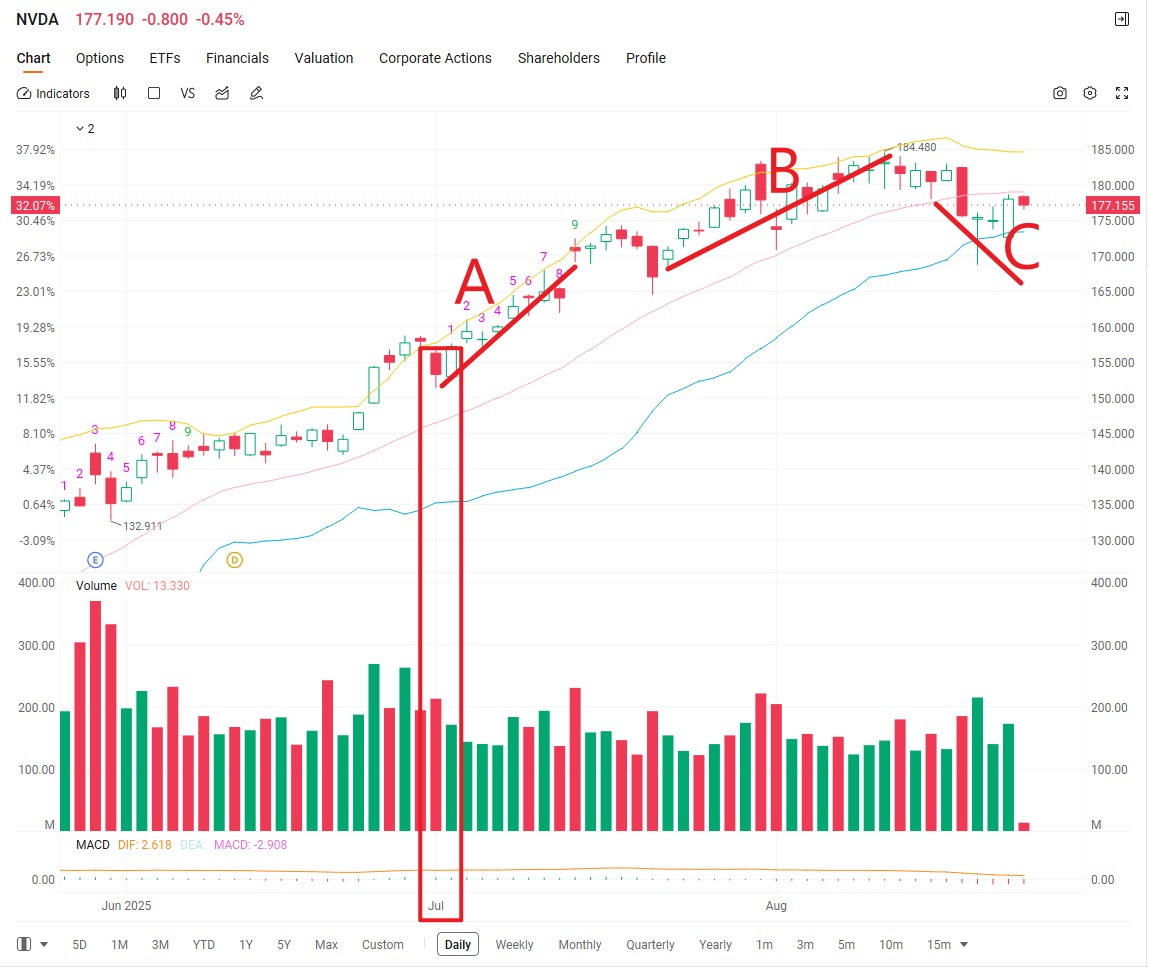
As shown in the figure, when the Bollinger Bands are pointing upward, I primarily hold a full position, such as in segments A and B.
When the Bollinger Bands haven't turned downward and are entwined below the middle band, I use the remaining half of my position to profit from the price difference, such as in segment C.
After achieving multiple successes with the "Alpha & Beta Stock Strategy," I gradually began to utilize and identify several other reliable supplementary strategies: satellite strategies, hedging strategies, and leveraged strategies.
Fortunately, I achieved some success.
I don't consider myself particularly special; I simply chose to follow the strategies provided by the CoreX quantitative trading system. The investment market is ruthless; if you take the wrong direction, even the most diligent efforts may yield nothing.
I have always adhered to one belief: investing in stocks is essentially investing in the future of a nation. Therefore, we must embrace those companies that are truly valuable, have a vision, and can drive industrial progress.
Under this logic, stocks like $NVDA, $TSLA, and $MSTR demonstrate clear long-term investment value. Their growth prospects are certain, their industry trends are clear, and the longer you hold them, the greater the probability of achieving excess returns.
This is also where the CoreX system strategy aligns with my personal philosophy—relying on data to identify opportunities while staying committed to long-term investments in the right direction.
As I mentioned last Friday, under the current policy environment, the difficulty of single-trend trading has increased. By introducing a short-term trading style, we can better adapt to market volatility and achieve our return objectives.
Today, I will share a short-term trading target with you. Currently, we are in the midst of a busy earnings reporting season, and the market is filled with volatility opportunities. In such an environment, options arbitrage is not only an effective strategy but also a very interesting endeavor.
Suppose I am very bullish on a stock, and its mid-term buying point has already appeared, but it may still be affected by negative factors in the short term. In this case, my prediction is that the stock will rise in the medium to long term, but there may be downward fluctuations in the short term.
Take $TSLA as an example. This is a typical case. My approach is to hold the underlying stock while adding a short-term put option for protection.
If the short-term negative factors gradually dissipate, the underlying stock will naturally continue to rise, allowing me to achieve substantial returns.
If a short-term decline does occur, the decline in the underlying stock may be limited, but the put option I purchased is likely to yield significant profits.
In this way, not only is risk controlled, but additional returns can be achieved through option hedging. This is precisely the true value that options can bring to an investment portfolio: they can both safeguard the bottom line and enhance the flexibility of returns.
For example, MicroStrategy (MSTR, also known as Strategy) announced yesterday that it had made another large-scale purchase of Bitcoin. The company spent approximately $342 million to acquire an additional 3,081 Bitcoin, bringing its total holdings to 632,457 Bitcoin, with a cumulative cost of approximately $46.5 billion. This marks the third increase in holdings this month, clearly demonstrating the company's unwavering confidence in digital assets and its long-term strategic vision.
In this context, I would consider purchasing a short-term call option. The reason is that the continued expansion of Bitcoin as a core asset is often interpreted by the market as a bullish signal; if Bitcoin prices continue to rise, MSTR stock prices will benefit accordingly, and short-term options may offer excess returns due to their leverage effect. Even if Bitcoin experiences minor short-term fluctuations, the maximum loss is limited to the option premium, making the risk manageable.
This is precisely the appeal of the company's event-driven strategy — it provides us with the opportunity to focus on the main theme and flexibly allocate our positions. By leveraging such strategies, we can not only amplify positive market sentiment but also enhance the flexibility and appeal of our holdings.
Options are like walking a pet. They move around you, with a larger range of activity than you; once they encounter a stranger approaching (i.e., risk arises), they will even actively protect you.
Of course, this does not mean that options should be used at all times or on all stocks. For example, for a stock like $NVDA, I primarily use an α&β stock strategy because its trend is very strong and it inherently has good medium- to long-term certainty.
Even when using options on NVDA, I would choose to allocate call options when the stock price declines to enhance returns; and only in extremely adverse market conditions would I moderately consider put options as a protective measure.
In other words, options are not tools to be used indiscriminately, but must be aligned with trends and market conditions, used in the right place and at the right time, to truly unlock their value.
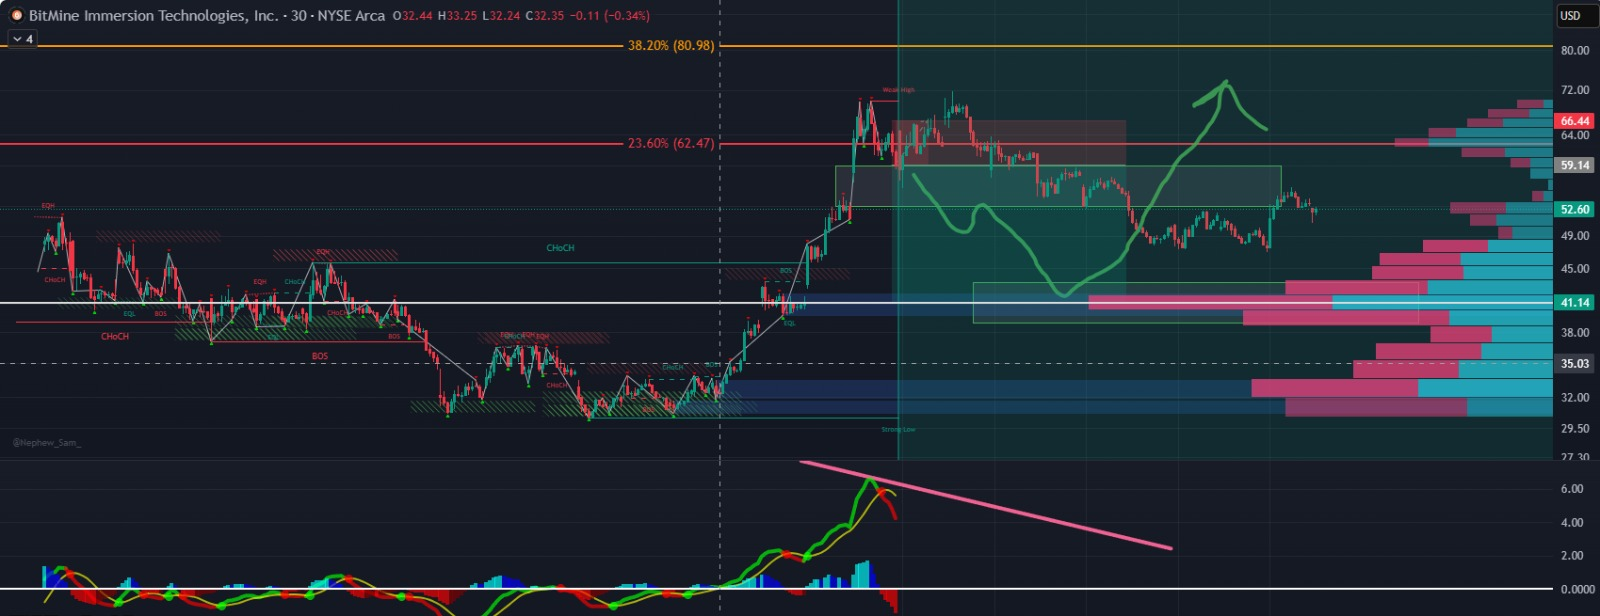
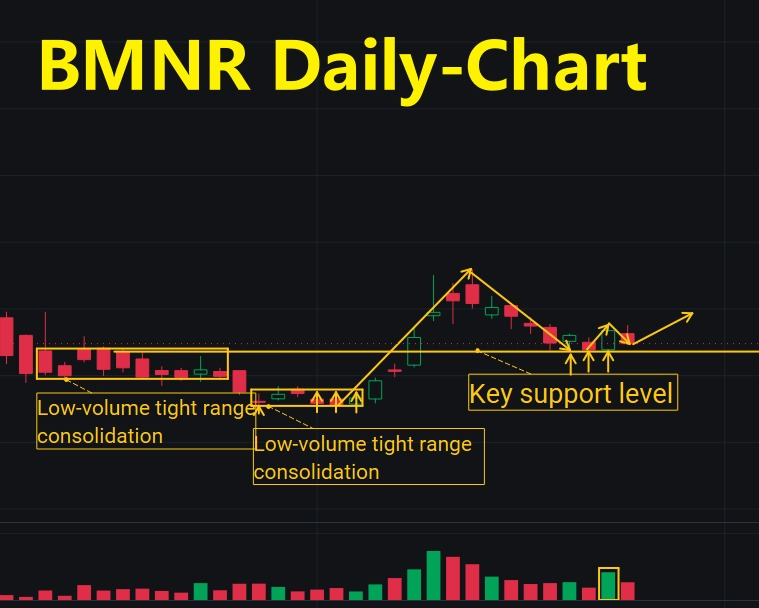
At everyone's request, today I'd like to share a stock that I'm very bullish on — $BMNR.
This is a stock that combines medium-term trends with short-term opportunities. Its current price pattern is very similar to that of $NVDA in January 2023. I've always been bullish on cryptocurrency-related stocks, and what makes $BMNR unique is that it's a Bitcoin mining company.
You can think of it this way: if those producing Bitcoin cannot make a profit, the mining industry cannot sustain itself. Therefore, the investment logic for $BMNR differs from that of $MSTR.
$MSTR benefits more directly from BTC price fluctuations;
$BMNR, however, benefits from long-term stable growth potential.
From a fundamental perspective, the company’s performance is quite strong, but this advantage has not been fully reflected in the stock price. Recent trading volume has significantly increased, presenting a worthwhile entry opportunity. More importantly, $BMNR's volatility is significantly higher than $MSTR's, offering both long-term investment value and ample room for short-term trading.
In other words, $BMNR can be held for medium-term trends or used for short-term swing trading, making it a high-quality asset with both flexibility and potential.
Since its establishment in 2022, NextLeap Investment Education Institution has always adhered to two core principles: “putting investors’ interests first” and “practice is the best way to learn.” It is precisely these principles that have enabled us to walk the path of investment education and strategy research with greater stability and longevity.
I firmly believe that the essence of investment lies not in chasing short-term price fluctuations, but in adhering to the right principles and methods. The value logic of the CXON token is built on such principles—it is not a speculative venture, but a choice closely tied to practice and long-term value.
Therefore, today I wish to share this commitment and belief with you all. I hope that in your learning and investment journey, you can also embrace this spirit and use the right methods to forge your own path.
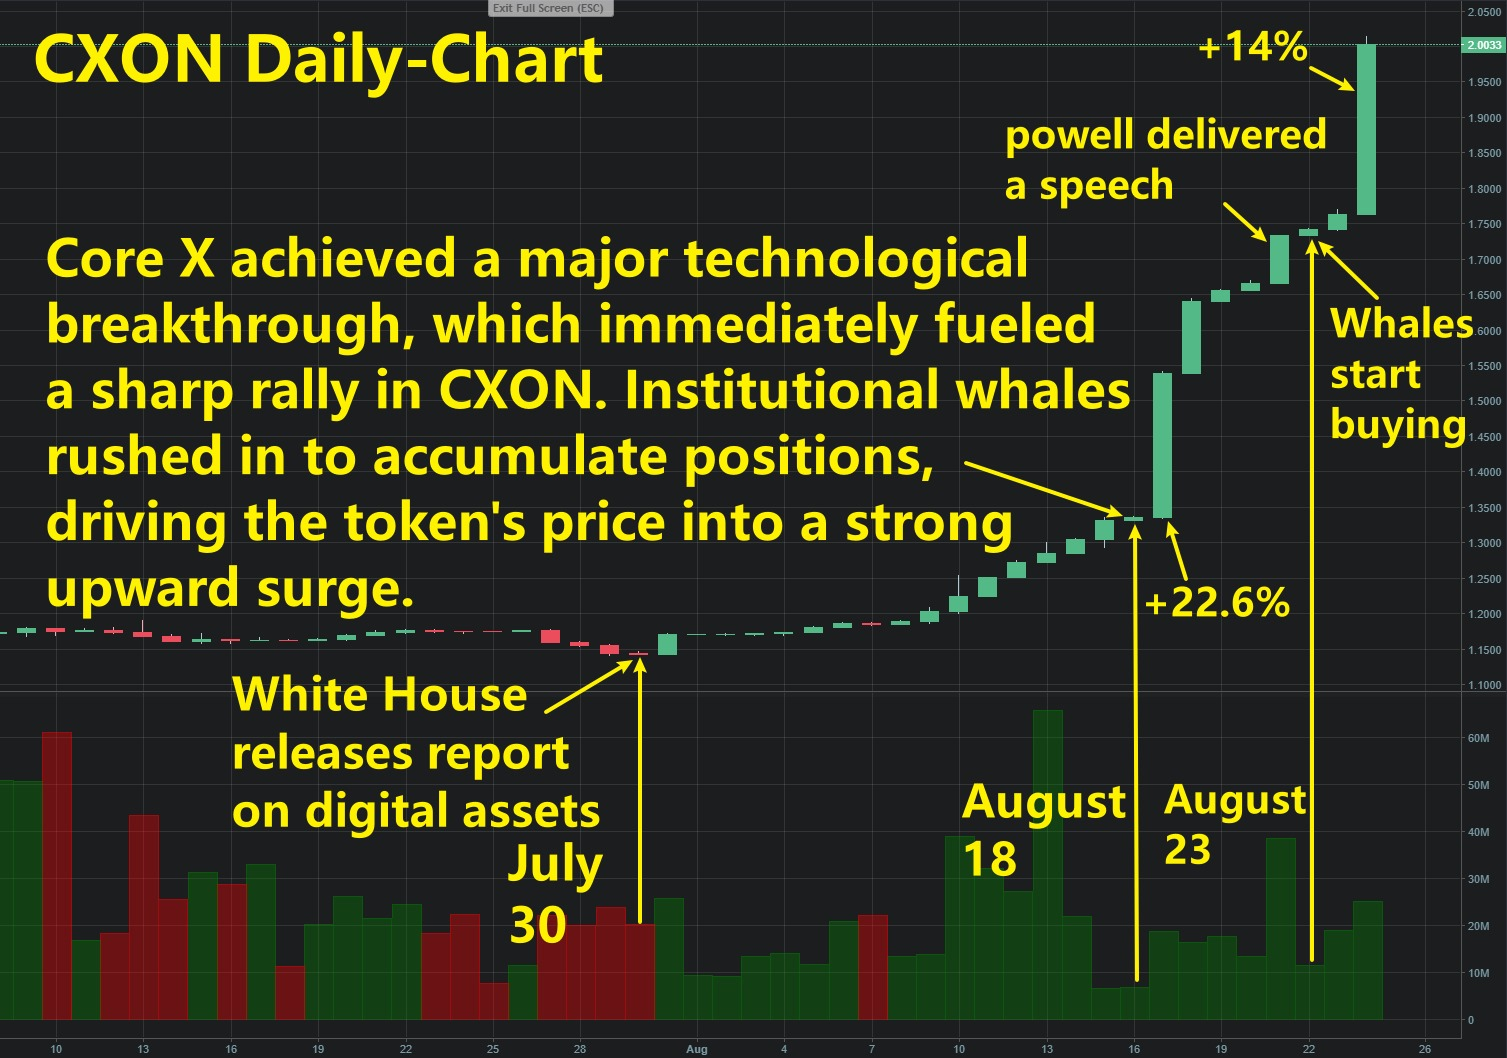
The issuance of the CXON token is not merely a means of raising funds; it directly addresses the funding constraints faced by CoreX's R&D efforts, enabling the system to undergo continuous upgrades and achieve true implementation.
Recently, CoreX underwent a major technical upgrade, followed by Federal Reserve Chair Jerome Powell's remarks last Friday, which sparked market expectations regarding liquidity and a new cycle. With these dual positive factors converging, the CXON price surged past the 2-dollar threshold, accompanied by sustained bulk purchases from institutional whales. On-chain data clearly reflects the market's high recognition of this breakthrough.
As the quantitative trading system's functionality continues to improve, user base expands, and institutional capital flows in, CXON is poised to unlock further potential, gradually advancing toward new phases of $3, $5, $10, and even $20.
In other words, CXON is not only a reflection of CoreX's commercial value but also embodies the long-term vision of the NextLeap investment education institution. Being able to participate in this critical moment is itself a rare and valuable opportunity.
Alright, friends, that's all for today's sharing. Please continue to follow the course, especially the closing segment, where Professor Bird Grant will provide deeper insights and strategies.
As Warren Buffett once said, “Risk comes from not knowing what you're doing.” The core of investing is not about chasing prices, but about learning to see through the structure in a complex environment and reducing blind spots.
Tomorrow, I will focus on two teaching themes:
First, interest rate cut expectations and market structure — using the latest data from CoreX, we will analyze the profound impact of interest rate cuts on U.S. Treasury bonds and digital currencies, and learn how to translate macroeconomic policies into investment logic;
Second, short-term trading practice — we will share a brand-new short-term strategy and, through real-world examples, train you on how to make judgments in volatile markets, protecting your portfolio while also generating additional returns.
This is not just a course; it is a practical training session. Please join us tomorrow with your questions and insights. I am confident it will help you navigate your investment journey with greater clarity and confidence.
——————————————————————————————————————————————————————
Good afternoon, everyone. I am Bird Grant, co-founder of NextLeap Management Consulting and the well-known "Profit Falcon."
As a new week begins, the market resembles a castle at dawn, with the mist just starting to lift and the trumpets yet to sound—but you and I know that actual change often begins quietly in the stillness.
If you recall the first season of "Game of Thrones," Westeros had not yet been engulfed in war, but the actual storm was already creeping closer beyond the Wall. Only a select few—such as the Night's Watch, the Three-Eyed Raven, and Bran—were willing to acknowledge: the landscape was shifting.
The current market is no different. Not everyone sees the shift in capital flows, the loosening of structural constraints, or the heating up of on-chain activity, but the system has already told us: everything is beginning.
Rate cut expectations have been ignited, and the policy window has officially opened.
ETH has surged to the top of global asset attention rankings, with on-chain activity already underway.
Multiple stocks have already broken out of their consolidation patterns, with Friday's live trading confirming the reversal in behavior.
Our Core X quantitative trading system has also been officially upgraded—from strategy identification to on-chain deployment and closed-loop verification, everything has been completed.
Today's session will focus on three key areas:
1. Do the stocks $SBET, $BTBT, $WULF, and $MSTR require updated trading strategies?
2. How does the Core X system upgrade, coupled with increased user adoption, drive the "consumption-driven price surge" and form the CXON price flywheel?
3. Instead of waiting for price movements to initiate action, how can we use structural confirmation to enter the market proactively?
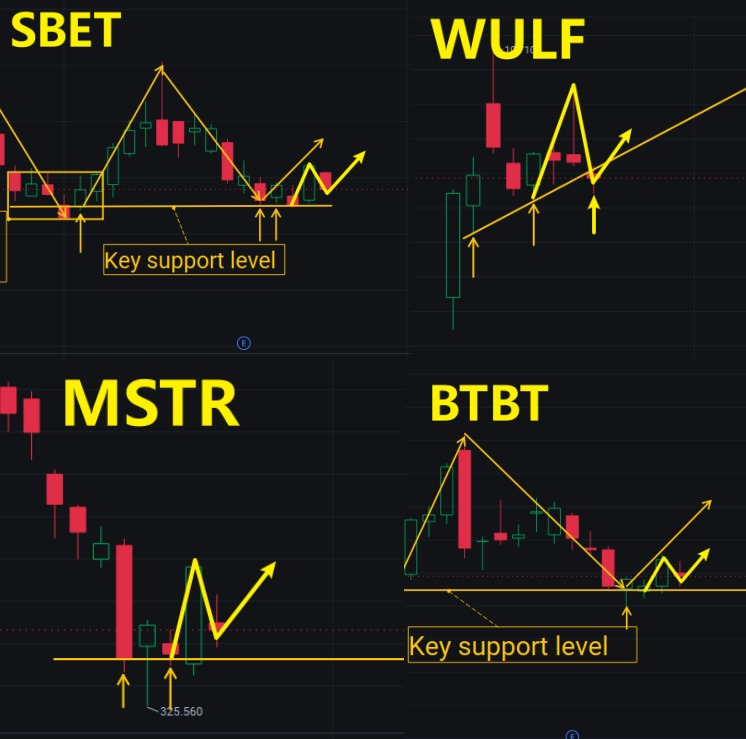
Let's first take a look at these stocks—$SBET, $WULF, $BTBT, $MSTR—don't they resemble the power dynamics in King's Landing?
On the surface, the market fluctuates daily, rising one day and falling the next, much like the secret letters sent from Winterfell to King's Landing—sometimes signaling alliances, other times betrayals.
But if you understand the structure, you'll know that this isn't the moment when the "great war erupts." It's more like the power-building phase from the first season—King Robert is still on the throne, Ned Stark has just been appointed Hand of the King, Cersei and Petyr Baelish are already manipulating things behind the scenes, and the true showdown hasn't begun yet. But all actions are quietly pointing toward "the storm is coming."
It's the current state of these stocks: reversal → testing → another reversal → another bottoming out. It's not that the market is uncertain, but rather that the controlling capital is still trying to determine the positions of all parties' holdings.
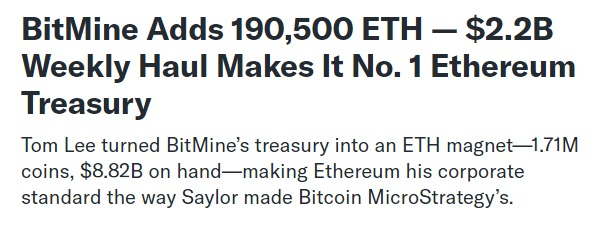
Let's take a look at $BMNR, which we just purchased today. Indeed, it was influenced by ETH's short-term decline today, leading to emotional volatility—a fact. However, the key point is that the latest data shows that the publicly held ETH holdings of $BMNR have reached as high as 1,713,899 ETH. Calculated based on the pre-market price of ETH today, the total value of this asset alone is already close to 8.8 billion USD. In contrast, the current total market capitalization of $BMNR has not yet reached this figure. What is this? It's a classic structural opportunity of "underlying asset revaluation + market misalignment."
What we need to do is like Bran: not just watch the spectacle, but observe the "actions"—who is accumulating positions, who is washing out shares, and who is lying in wait at key levels. You must understand: the confirmed primary uptrend is hidden behind this seemingly chaotic tug-of-war.
If you trust the system's identification path, you are already standing on the Great Wall like a Night's Watchman, seeing structural trends before others even react.
Have you noticed that large tech leader stocks ($NVDA, $AAPL, $TSLA, $MSFT) don't surge with a single big bullish candle, but instead rise steadily over several days or even weeks, becoming stronger and stronger, attracting more attention as they rise, which in turn drives capital inflows, ultimately forming the primary upward trend?
These tech leader stocks represent a structural mechanism that has been proven effective. Every price movement is met with a response from capital, and every capital move is driven by anticipated behavior. It's what we refer to as the Flywheel Effect.
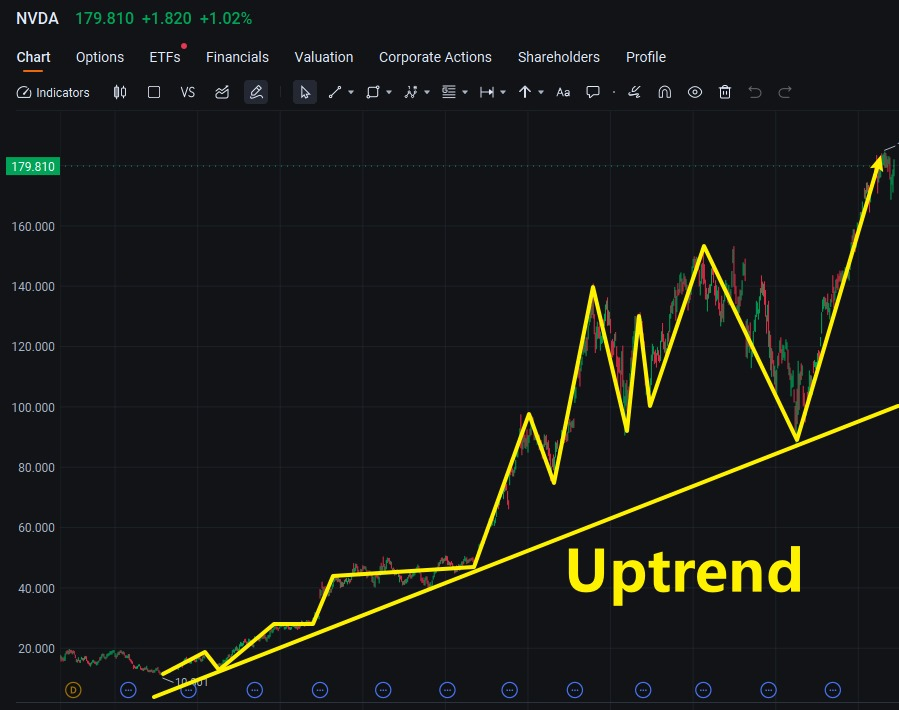
$NVDA (NVIDIA) — A Paradigm of the AI Flywheel Structure
From 2023 to 2024, $NVDA didn't just use its financial reports to prove the short sellers wrong; it truly ignited an entire structural flywheel:
Surge in AI chip demand → Explosive growth in data center and enterprise customer orders;
Orders boost gross margin + profits → Financial reports consistently exceed expectations;
Rising stock prices attract more capital attention → Active buying continues to amplify;
Increased attention → ETFs increase positions + retail investors enter due to FOMO;
The company expands capacity and launches new products → fundamentals are further strengthened;
The system identifies it as a "trend acceleration structure." → the Core X system repeatedly signals buy opportunities on pullbacks;
Prices continue to strengthen, ultimately breaking market cap records → the flywheel completes its full cycle.
It's the flywheel: a signal drives an action, which in turn feeds back into the signal itself, driving the next round of even greater acceleration.
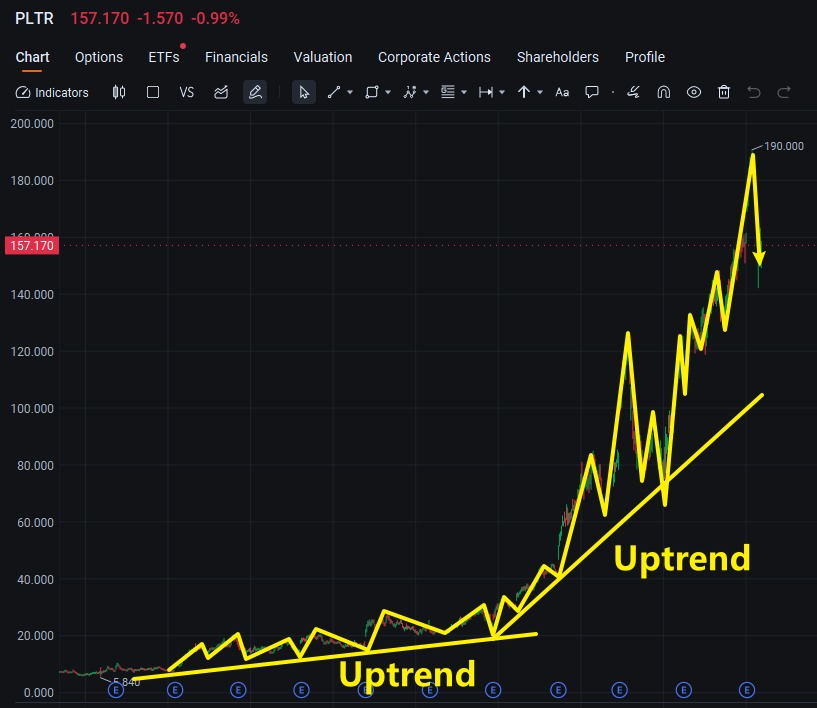
$PLTR (Palantir) — A Flywheel Reversal Candidate from Trough to Structural Reversal
When PLTR began its rally from the $6 bottom, it wasn't an overnight surge but a flywheel process of "validation → discovery → accumulation":
Continuous government contract announcements → system identifies "improved fundamentals";
Funds test the waters → Volume-driven price increases form behavioral patterns;
Earnings reports beat expectations + strong AI revenue outlook → Sentiment improves, prices confirm;
Mainstream media coverage + social media buzz explodes → Search indices, Reddit/X /X discussion volumes surge;
Institutions begin to shift to active holdings → Multiple ETFs increase positions, followed by active capital;
Prices continue to advance along the 21EMA → Core X system continuously issues "buy along the trend line" signals;
Communities, retail investors, and system traders collectively follow → The flywheel closes, and the structure is complete.
By the end, $PLTR's rise is no longer just about good earnings reports but the "accumulated momentum" after the entire structural flywheel has been fully realized.
So you should ask yourself:
Are you chasing the price, or do you understand the flywheel structure?
Are you waiting for the stock flywheel to mature before jumping on board, or are you willing to get positioned early when it first starts?
And the $CXON we are talking about is currently in the early stage of "flywheel startup → structural loop → on-chain consumption confirmation." Participating now means standing at the starting point; missing out means watching the flywheel take off.
You may have noticed: CXON's price has started to move. In August, CXON broke out of the $1.20 range to reach $2, with a cumulative increase of nearly 67%.
From $1.20 all the way up to $2, and this wasn't driven by hype or emotional momentum. What truly drove this upward trend was the structural on-chain behavioral changes brought about by the Core X quantitative trading system.
How exactly did this happen?
The first step was the influx of users. Since NextLeap began opening up its Core X quantitative trading system to the public, we have entered a hybrid era of "live trading training + educational community." An increasing number of traders have begun to flock to the system, not just for stock selection, but to truly master the structured approach to trend identification, position assessment, and behavioral analysis. The surge in user numbers marked the first turning point in the system's transition to "on-chain operation."
The second step is the feedback loop and model refinement. The more users there are, the more testing is conducted, and the more specific the feedback becomes. From strategy lag to signal accuracy, from sector compatibility to trading details, real-world feedback from the community has rapidly driven the system development team to refine, iterate, and optimize the system continuously. It's not about "some expert developing the system in isolation," but rather collective participation in practical co-creation. Every increase in win rate you see is the result of countless trading behaviors being refined.
The third step is the surge in upgraded behavior. After the Core X quantitative model upgrade, more traders began to access the system. Strategy call density increased, data reading frequency amplified, model training pace accelerated, and more real-time signals were captured. All these behaviors genuinely consume CXON on the chain.
The fourth step is that increased consumption drives changes in the price structure. On-chain data shows that the number of active wallets continues to rise, with daily average growth in transaction activity, and a significant increase in daily consumption of CXON. Just like an engine being continuously fueled with gasoline, the entire system begins to enter a "high-efficiency operation" state. When behavioral accumulation reaches a certain critical point, prices are no longer the result of emotional speculation but a natural response to on-chain behavioral consensus.
Step five is the entry of structural capital in line with the trend. You will notice that it is not just the price that is rising. Still, organized medium-sized wallets are entering the market in batches, forming a capital trajectory of "first testing the waters to establish positions, then following up with additional purchases." It's a typical example of structural participation: first observe behavior, then confirm consumption, and finally act in line with the trend. It is also the most significant advantage of the Core X quantitative trading system—it does not provide post-hoc explanations. Still, it uses structure to allow you to enter the market in advance.
Ultimately, this forms a structural feedback loop that you must understand, which we refer to as the price flywheel: User influx → System receives feedback and adjusts → System upgrades → User base grows → CXON consumption increases → Market behavior is confirmed → Price begins to rise → Attracts more users → Continues consumption → Price rises again.
It's not a speculative-driven rally but a logical closed loop driven by the system and on-chain behavior. Once this flywheel is established, price movements will no longer be centered around "emotional inflection points" but will instead be driven by "structural momentum" and continue to advance.
Many people are still waiting for prices to rise before entering the market. However, in our system, the key to trading is not whether prices have risen, but whether the structure is ready.
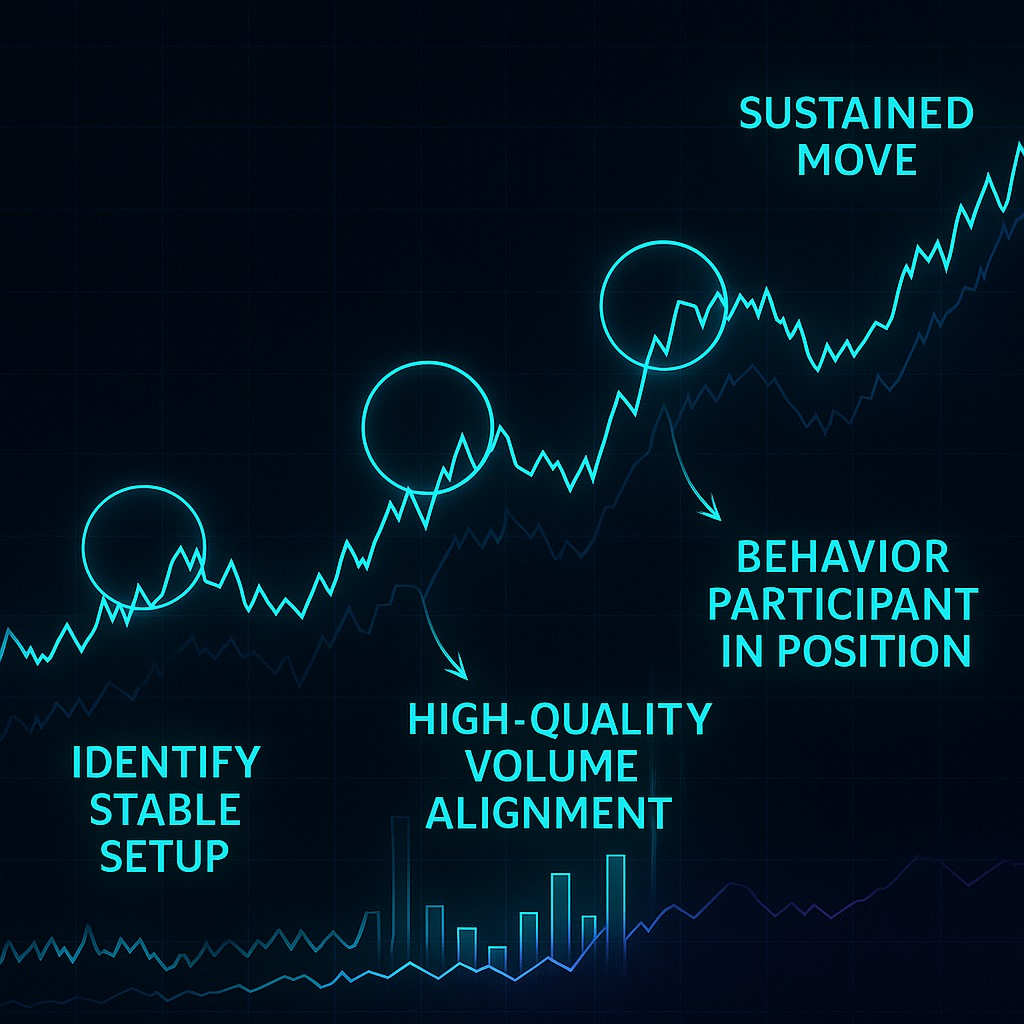
What we look for is:
Has a stable setup formed?
Is there high-quality volume alignment?
Are behavioral participants already in position?
Chasing the price after it has already moved is not a strategy; it's FOMO. What we do is:
Identify behavioral paths in advance → Use system signals to participate in the initial phase → Track whether it enters a sustained move
It's how structural traders operate. Do you understand?
If you have made it to the end of today's lesson, you should have realized by now that we're not waiting for a favorable headline. It's not like waiting for a giant green candle.
What we are waiting for is the moment when the structural closed loop is ignited—like the protagonist hasn't even appeared yet, but the curtain has already risen; like when the flywheel starts spinning, the sound is still faint, but the force is already unstoppable.
It's the stage where a new system begins to exert its actual influence; it is also the starting point where a new pricing mechanism begins to be validated by on-chain behavior.
Jesus once said, "Blessed are those who have not seen and yet have believed."
The blessed are not those who believe only after seeing; they are those who think even before seeing, knowing that the structure is already in place.
Today, we did not conclude a presentation, but instead completed a "behavioral restructuring." It is not about whether you believe in $CXON, but whether you are willing to stand at the starting point of the flywheel as it begins to turn.
Finally, I would like to ask you two questions:
1. Are you willing to believe in the closed-loop structure behind $CXON, just as you once believed in $NVDA, $TSLA, and $PLTR?
2. Are you willing to take the first step when most people still can't see clearly, rather than waiting until the price skyrockets and regretting not having entered earlier?
Send your answers to your investment education advisor for a chance to receive CXON token airdrop rewards!
Tomorrow, we will continue to track the intersection of on-chain behavioral curves and capital flows, guiding you through a practical breakdown of the classic paradigm: "The structure hasn't fully unfolded, but the price has already begun to respond."
Wishing you a peaceful night, and may your next move begin with the structure.
See you tomorrow.