July 17, 2025
July 17, 2025
Yesterday's market performance was perplexing—the index neither rose nor fell, and there was no shortage of positive news, yet the market reaction was lackluster. You might ask: If the CPI data is so good, why isn't the stock market rising?
This is precisely the key point I want to clarify today. The June CPI data released on Tuesday showed:
CPI rose 2.7% year-on-year, higher than the expected 2.6%, marking a localized rebound this year;
CPI rose 0.3% month-on-month, the largest single-month increase since January;
Core CPI rose 2.9% year-on-year and 0.2% month-on-month, largely in line with expectations.
These figures indicate that inflation has rebounded within a controllable range, with the overall trend still declining, but the short-term increase slightly exceeded market expectations, further intensifying the market's speculation about the balance between the Federal Reserve's “dovish vs. hawkish” policies.
However, I would like to emphasize that rising expectations for interest rate cuts do not necessarily mean that the US stock market will immediately rise.
Because the direction of the U.S. stock market is never determined by a single data point; it is more like a dynamic system—interest rates, employment, consumption, corporate profits, and international developments—any of these variables could become the dominant force driving short-term fluctuations.
In other words, even if you hold a “good hand,” the market may not respond positively. As mature investors, we must learn to remain rational in such an uncertain environment.
Next, please pay close attention to the following: (July 17, 8:30 a.m. Eastern Time) The June retail sales data will be released, which is an important indicator of consumer strength. If the data is weaker than expected, it may trigger further concerns about an economic slowdown; if it exceeds expectations, it could temporarily boost market sentiment.
Therefore, today is not the optimal time to act, but rather a phase for observation, strategic positioning, and building momentum.
The market does not wait for anyone, but it also does not consistently withhold opportunities. What you must do is prepare your own rhythm before the market signals its true direction.
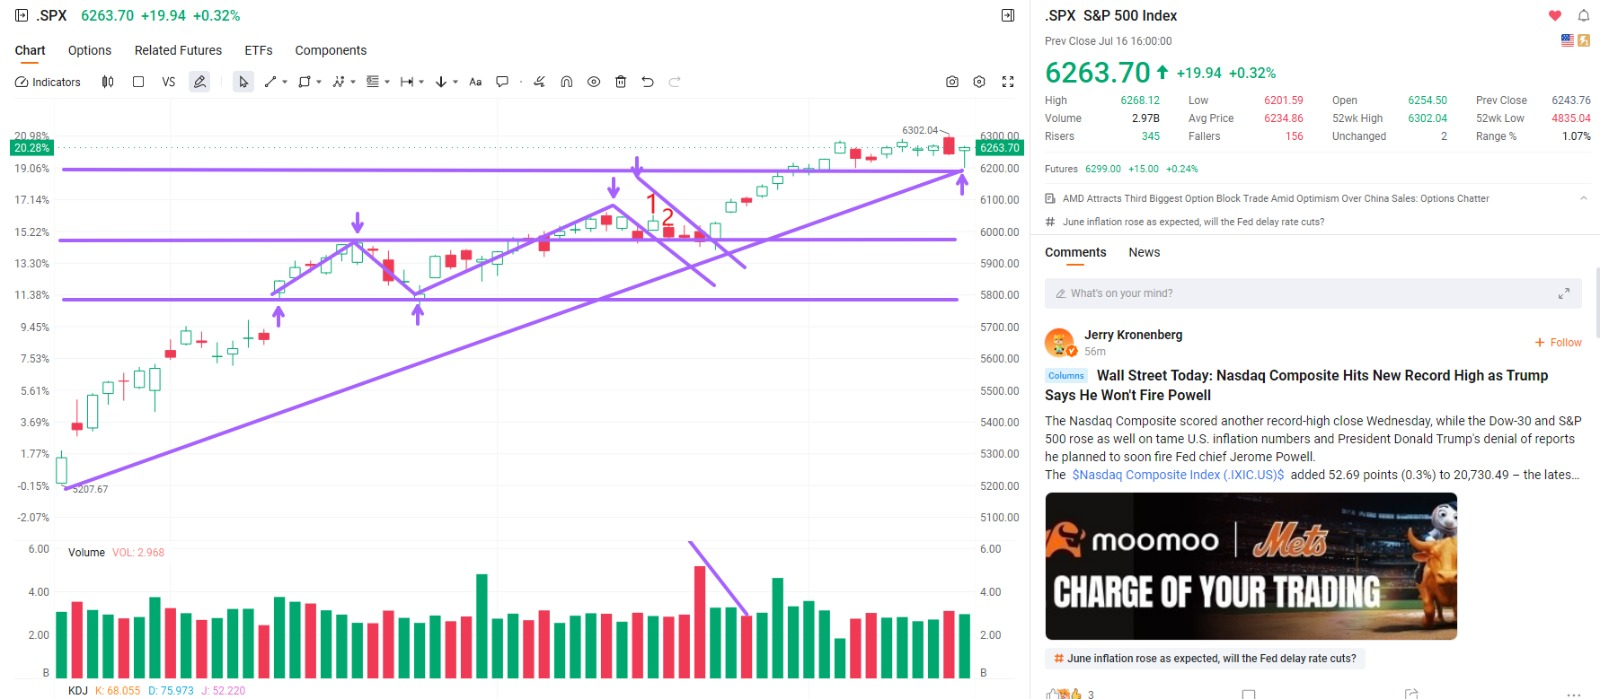
Before the official market opening today, we need to pay special attention to several key technical signals from the S&P 500 index:
First, from the perspective of trend structure, the index is currently testing a critical trend support rebound line. This indicates that the previous upward trend has been broken, and the current rebound is more of a technical correction. If we do not see a strong “green candle” (i.e., a long bullish candlestick with significant volume) breaking through this area today, the momentum of this rebound may come to an end.
Second, pay attention to the descending trend line formed from the recent highs at points 1-2-3, which is currently acting as strong resistance. This is an important resistance zone for bulls attempting to break higher—if it cannot be broken, it may trigger a new downward structure.
The third signal is the change in trading volume. Over the past seven trading days, despite the index's gradual upward movement, the volume of each rebound has been decreasing, indicating a typical “shrinking volume rebound” state, which signifies a decline in market trading activity and insufficient confidence.
In summary, my recommendation before today's opening is to remain cautious and wait for the upcoming economic data to signal the direction.
This is not a time to act hastily, but rather a moment to calmly assess the situation and make cautious strategic decisions. In investing, it is not always about who reacts fastest, but who can maintain patience and discipline.
By observing technical patterns, it is not difficult to see that the SPX index is facing an important rebound threshold, namely the lower boundary of the upward trend line. This indicates that the rebound is a corrective movement following the breakdown of the upward cycle of the S&P 500 index. If this rebound fails to break through with a strong green candlestick chart and continue its upward momentum, it will signal the end of this rebound phase;
Secondly, the index is facing the pressure of the downward trend line formed at the high point of this round of the market. The downward trend formed by points 1/2/3 often represents an important resistance level for the bullish trend. If it cannot be effectively broken through, a new downward trend may emerge;
Additionally, over the past seven trading days, the SPX's upward movement has been characterized by a stepwise decline in volume, indicating a decline in trading activity and a lack of trading confidence.
Therefore, I believe Thursday's market movement aligns with overall market expectations, so it is important to maintain a vigilant observation mindset and await changes in economic data releases.
My Thursday risk management strategy:
Tomorrow's retail sales data release will be a key indicator of US economic activity. If the data shows strong consumer spending, it indicates stable consumer confidence, a healthy job market, and robust business operations, which typically signals an optimistic economic outlook and supports stock market gains.
However, my personal assessment is that a more likely scenario is: weak retail sales data and declining consumer momentum, which the market may interpret as a precursor to economic slowdown or even recession, thereby triggering short-term downward pressure on the stock market.
Therefore, my portfolio strategy remains prudent: Treasury ETF, high-dividend assets, companies with strong fundamentals, and digital currency-themed stocks form my defensive portfolio, which has stronger volatility resistance and is more suitable for the current uncertain market environment.
Stay confident and follow this approach—it is the correct mindset to navigate market volatility.
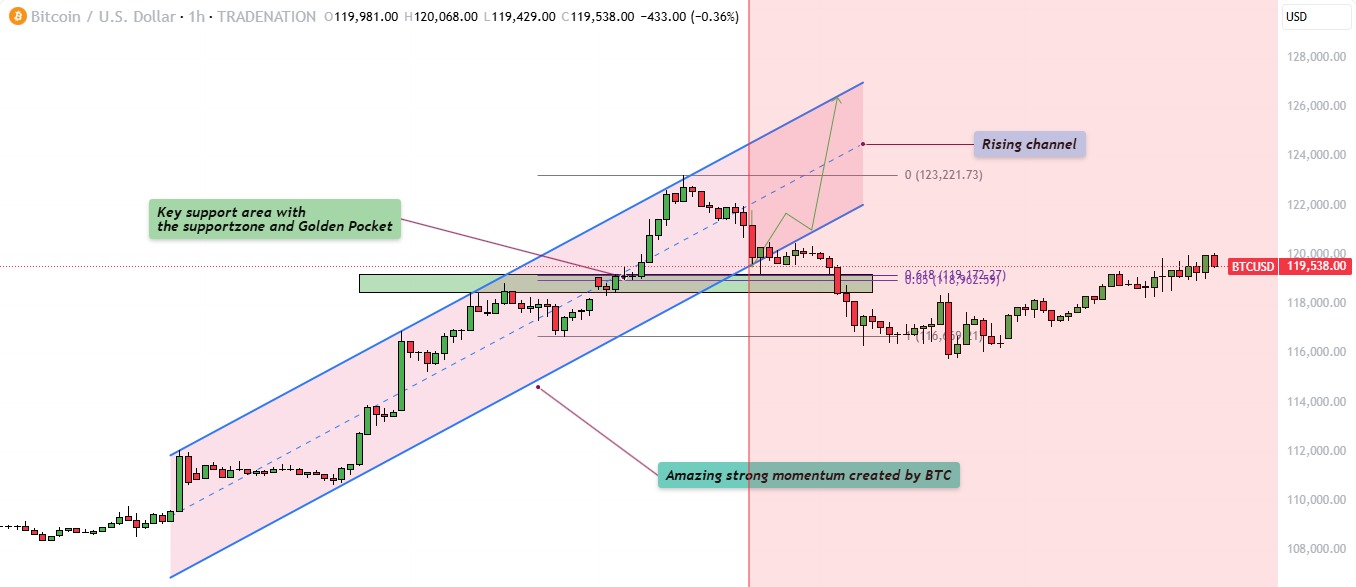
Why would rising expectations of interest rate cuts become a catalyst for Bitcoin's rise?
If tomorrow's retail sales data comes in weak, the market may interpret it as follows: consumer spending is slowing, economic growth is under pressure, and the Federal Reserve is more likely to begin cutting interest rates in September to avoid an economic slowdown. This logic of “bad for the economy, good for liquidity” often directly drives up digital currency prices once accepted by the market, especially for mainstream assets like Bitcoin.
Why is that?
1. Lower interest rates, increased liquidity: A rate cut means lower deposit rates and reduced returns on the US dollar, prompting funds to exit low-yield assets and seek more promising investment opportunities. Bitcoin and other digital assets, which inherently possess high volatility and growth potential, naturally become the target of capital seeking safe havens and opportunities.
2. Lower funding costs and increased risk appetite: When financing costs decrease, investors are more inclined to allocate capital to “high-beta” assets, such as tech stocks and cryptocurrencies, leading to an overall increase in market risk appetite, which benefits digital currencies.
3. Weakening US dollar exchange rate boosts Bitcoin prices: Expectations of interest rate cuts drive down the US Dollar Index, and Bitcoin is priced in US dollars. When the dollar depreciates, the dollar price of the same amount of Bitcoin increases.
For example, in a high-interest-rate environment, 100 US dollars could buy 1 Bitcoin; after interest rate cuts, with the dollar weakening, you might need 102 US dollars to buy the same amount of Bitcoin. This is a real-world example of declining currency purchasing power and rising asset prices.
Therefore, as Bitcoin prices fluctuate around $119,000, there is no need for panic. Instead, hold onto your COIN with confidence, as it represents our resolve and foresight in the face of market volatility. You will soon see that this choice will become a source of pride in your account.
Alright, friends, let's get back to our options tutorial:
This week's learning has reached a very critical stage.
On Wednesday, we explained the investment logic and risk hedging value of government bonds.
Last week, we started the first lesson of the options tutorial, focusing on the structure and operation of options. Today, we will continue to delve deeper and use a real-life case study to transform theory into practical skills. Are you ready?
Assume that student Vincent purchased 3 put options on Apple Inc. on Tuesday this week, with the trading signal being: BUY AAPL 250725 205.00 PUT. What do you think is the core purpose of his participation in this options trade? Is it for short-term profit? Risk hedging? Or just a gamble? Now that the stock price has not yet shown a significant decline, he wants to cut losses today. Do you think this judgment is reasonable? If you were him, how would you maximize returns through this PUT contract? What selling timing would you choose? Would you wait until close to the strike price, or take profits early?
Alright, let’s take a short break—please spend ten minutes thinking about this question and share your answers or thoughts with your investment education advisor. In ten minutes, I will continue analyzing the logic and strategy behind this option trade in class, helping you truly master the core essence of option trading. See you shortly.
Option Trading Analysis and Explanation:
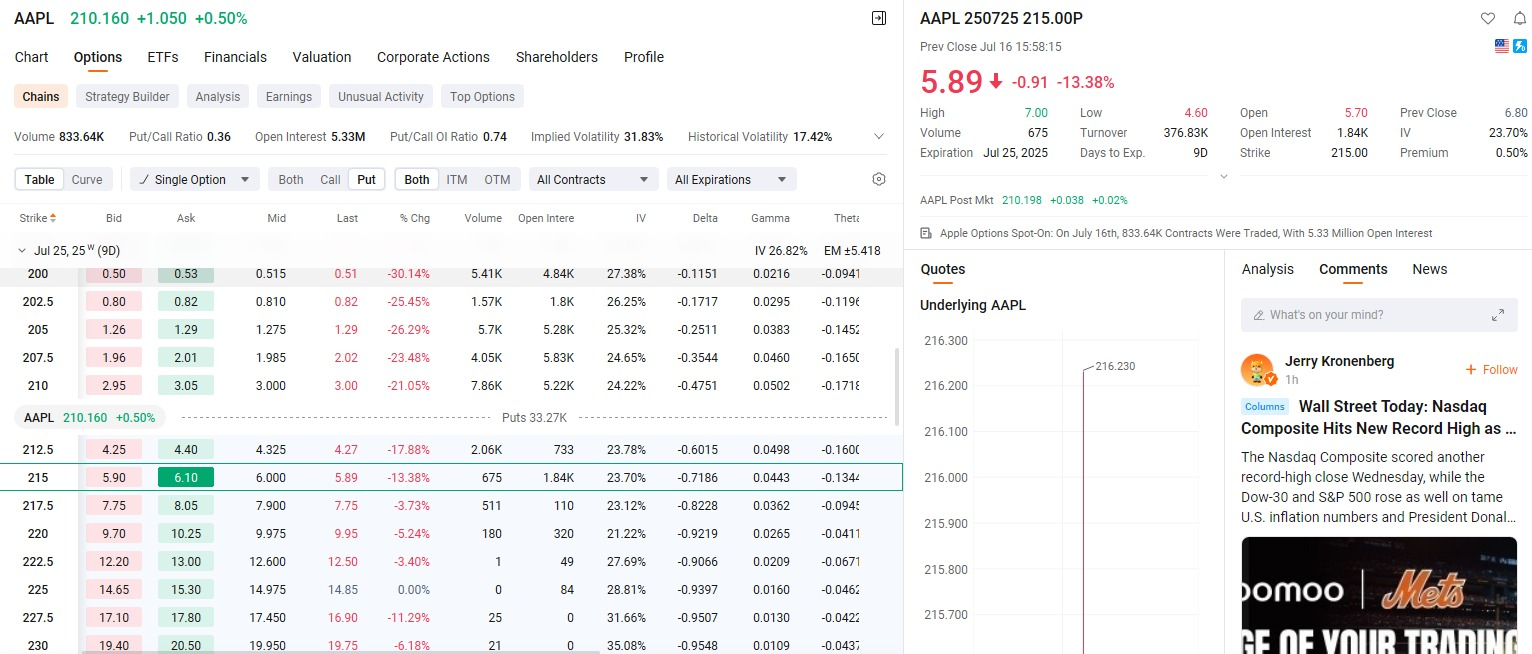
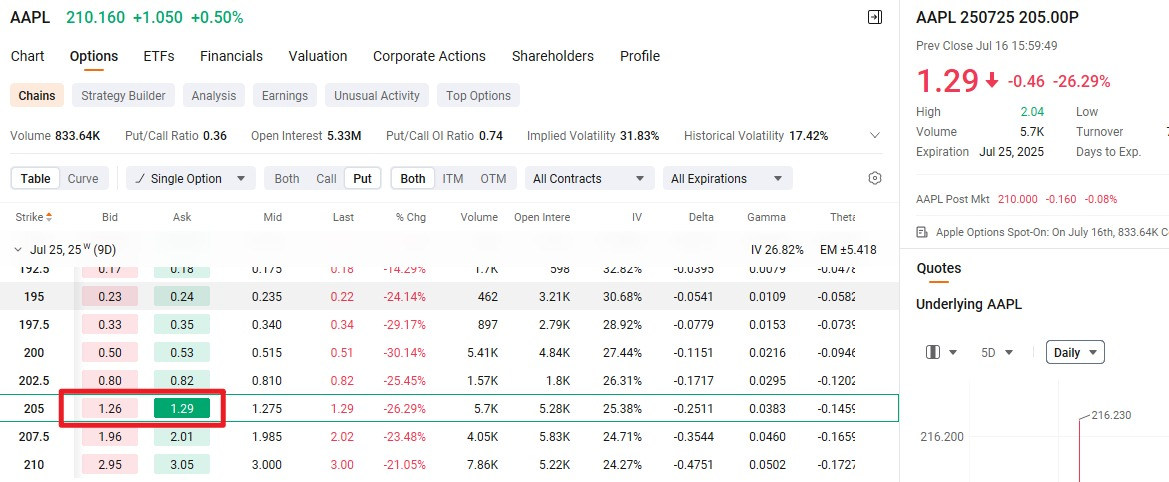
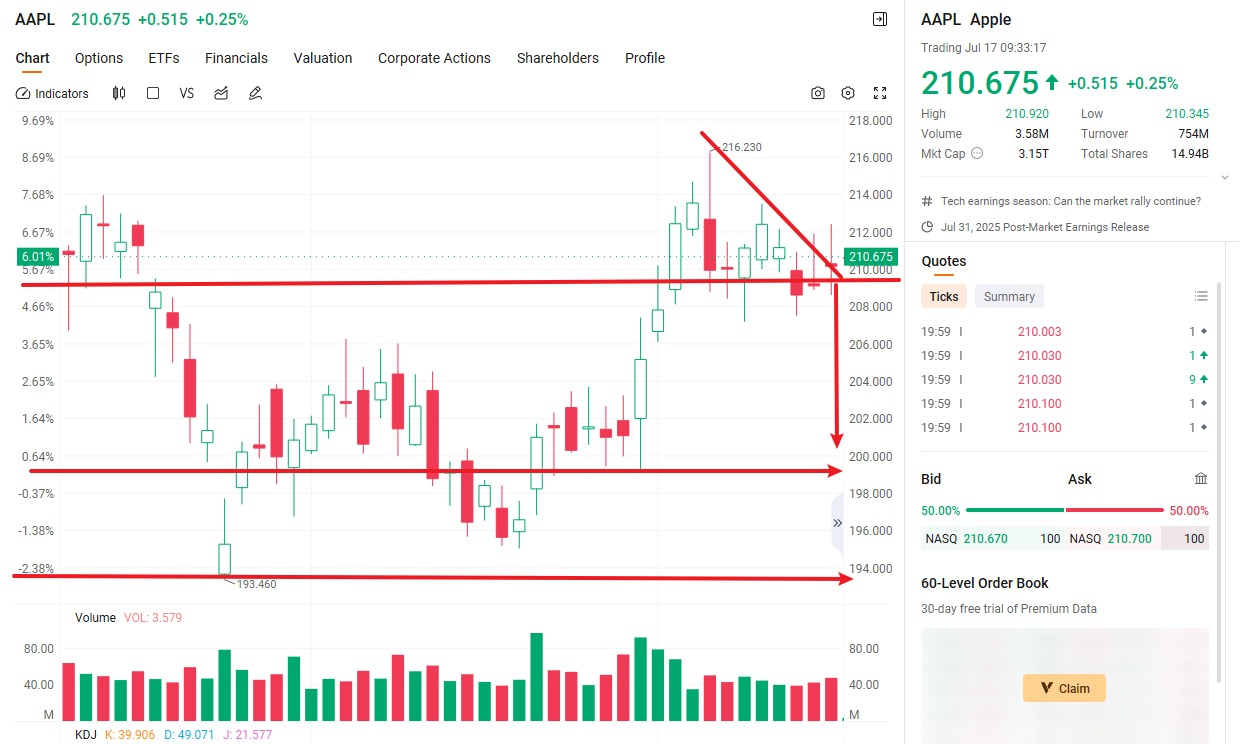
Let's review Vincent's option trade. Based on the trading signal he set: BUY AAPL 250725 205.00 PUT, this indicates that he expects Apple's stock price to fall below $195 before the option expires on July 25. Based on this market expectation, he chose a bearish option strategy.
Given the current market conditions, Vincent’s assessment is not without basis. We can see that Apple’s current stock price is around $209, already below his strike price of $205. From a technical perspective, the stock price had previously experienced an uptrend, but trading volume began to shrink. This “price up, volume down” pattern often signals a weakening of upward momentum.
Additionally, recent news of Warren Buffett reducing his Apple holdings has also put pressure on market sentiment. Based on these signals, I personally believe this put option likely has profit potential. However, interestingly, he is now beginning to hesitate and even considering exiting the position early. So I ask you: If you were Vincent, how would you interpret this trade?
Based on what we learned earlier, we know that the market price of options is volatile and changes at every moment.
Assuming that Vincent purchased the option on Tuesday, the market price corresponding to the option signal was $1.5 per share.
According to today's chart, the price of the option has fallen to $1.29.
The reason for the decline in the option price is that AAPL continued to rise today, leading the market to choose to sell it off, resulting in a price decline, which also indicates that its value is contracting;
At this point, Vincent faces a dilemma: he wants to cut his losses and sell the option today. Do you agree with this approach?
Perhaps he is worried that Apple will surge sharply, which is why he feels this urge?
Maybe, maybe not! Let me share my interpretation...
Here comes the point!
The core of trading options is time value + cost value;
Only by grasping these two important contents can you master the essence of options;
When Vincent wanted to cut his losses, he probably didn't realize that the current rise in Apple's stock price was limited,
and he was even less aware that when Apple's stock price fell in the following days, or even 1-2 weeks later, the price of the option would continue to rise. He was only focused on today or yesterday, which is a cognitive flaw;
I think when he reads this, he will realize he still has a chance, just like in an NBA basketball game—the final buzzer hasn't sounded yet, there's still time, and the score isn't decided. What matters is that you hold on, and you can still tie the game;
If he chooses to cut losses today, he may recover a small portion of the premium, but he loses the time value of winning in the future;
Just as when the final buzzer sounds, if that long-range three-pointer goes in, the outcome of the game will be reversed;
Do you understand why options don't cut losses?
Cutting losses on options is like giving up the game when the score is only one point apart in an NBA basketball game!
I think you understand now, right?
Since Vincent chose to continue holding this option trade—BUY AAPL 250725 205.00 PUT—after listening to my analysis, let's take a look at what kind of returns he could earn if his judgment is correct.
Vincent purchased 3 PUT options, with each contract representing 100 shares of Apple stock, at a purchase price of $1.50 per share.
Therefore, his total cost is:
3 contracts × 100 shares × $1.50 = $450
In other words, Vincent spent $450 to obtain the right to short Apple stock at $215 before July 25.
Assuming that on July 23, Apple's stock price fell to $200 as he had anticipated. At this point, the intrinsic value of this 215 PUT option is:
$215 - $200 = $15 per share (ignoring time value and volatility premium, etc.)
At this point, the market price of this option may be $15.50 (including a certain premium).
Vincent could then choose to sell the option contract at the market price of $15.50:
3 contracts × 100 shares × $15.50 = $4,650
Subtracting the $450 premium he originally paid:
Net profit = $4,650 - $450 = $4,200
In other words, even though Apple's stock price only dropped by 9%, Vincent achieved a staggering 933% return (4,200 / 450) through options!
This is the allure of options—leveraging small costs to generate significant returns. Do you now understand why seasoned investors use options as one of their tools?
Have you grasped the wealth-leveraging effect of “small investment, high leverage”?
However, when you apply time value appropriately and select the various factors of options configuration correctly, you will reap benefits beyond your imagination!
This is options!
This is the fun trading model!
Every student could be Vincent today, but I hope every student will master the key content of this lesson and acquire the knowledge on how to apply options. This knowledge will guide you toward a broader investment horizon to claim your own rewards. Yes, we only create winning strategies; we align with the strong;
When you join here, you must embrace the possibility of becoming stronger!
As I often discuss, when you use sincerity as the golden key to open the door to the community's investment education knowledge, your rewards will be the greatest. Now tell me, is it you?
Friends, the options knowledge we have learned today is not something you can easily learn in mainstream investment courses in the United States. This is the essence I have distilled from years of practical experience, and here you receive it for free. I hope you can truly feel the sincerity of my sharing.
And you have come here with the sincerity to learn, which means one thing: good luck is likely already on its way.
The next segment is crucial. You will participate in a Q&A session, which not only tests what you’ve learned today but is also a necessary step toward unlocking the “Lucky Wheel” reward. Please provide the answers to the following questions to your investment education advisor:
1. When I am bullish on a stock, can I choose to either directly purchase the underlying stock or participate in trading through options?
2. What kind of fintech tool is CoreX? What is its core value? Can more information be obtained through its official website?
3. In today's case, what is the exercise date for the options Vincent purchased? What is the exercise price? Does he expect the stock price to rise or fall?
Come on, friends, take some time to organize your thoughts and complete these questions.
As Jim Collins wrote in From Good to Great: “First, make sure the right people are on board and in the right seats, then decide where to drive the car.”
This is precisely the value of the NextLeap community—we hope you are the one who chose the right car and sat in the right seat.
We'll see you again on Friday. Let's look forward to good fortune together!
___________________________________________________________________________
Hey friends, good afternoon! I'm Bird Grant from NextLeap Management Consulting. Ready for some popcorn for today's lesson?
This morning's class is taught by Blake Shaw. Blake Shaw's lesson is more realistic than any American TV show you've ever watched - every reversal is about the outcome of your account. --An option contract, from just buying, to a small pullback, to almost getting scared off, to potentially doubling several times--the protagonist is you, and the outcome depends on how you make decisions and how you execute them.
And this operation we're doing in stocks is taking what we've been taught in class and applying it to the real market.
Today we bought $IONQ. It wasn't because of any news that started to brush up, or waiting for intraday amplification, but I personally confirmed it: the price repeatedly tested the key position, volume started to gather, and active buy orders gradually strengthened. I completed my position at $43.50.
This is not an opportunity to pile on the heat, but a setup that you have to recognize with your own judgment, and I've seen too many trades like this: you make a decision when the market is quiet, and by the time everyone starts to pay attention, the window has long since passed.
You don't need to wait for someone to say it before you dare to act. You need to be able to see it, make a move, and hold it.
Are you ready? We start now!
I'm literally so happy right now that I'm flying!
In the past three days, we've completed two beautiful trades on $ANPA - each of which, I personally made intraday judgments and actions based solely on my own intraday observations, price behavior perception, and trading experience.
On Tuesday, I took my first position at $3.969. There was a lot of intraday acceleration that day, and I noticed that the active buying was starting to turn sharper and the sentiment was a bit manic. I chose to sell all of it at the highs, locking in a +60% profit and a nice close without waiting for the market to decide my fate.
Wednesday just opened and the stock dropped off close to -5%. Many of you may still be on the sidelines, what I saw was that the structure was not broken and buying behavior was still there. I chose to re-establish my position in a more favorable position.
Today, I exited all at $6.126, again realizing a +41% profit on the cash.
Two exits and two cashes in three days, from Tuesday to Thursday - not by hunch, not by following the crowd, but by making a move after I personally saw the behavior confirmed.
It's not the account numbers that really excite me, it's knowing that you made every judgment right - that you read the signals, that you trusted your plan, and that you executed firmly enough.
For those of you who have done these two strokes together, have you started snickering in the group by now? No need to hide, I know you all want to pop the champagne.
And that's exactly what separates a guess from a trade.
Knowing the rules is one thing, being able to use them in real trading is where the real winners and losers are separated.
Everyone says they know setup, will look at the chart, but when it comes to the disk, the price jumps, news flying - you remember what your plan is?
Starting today, we'll talk about the most crucial part of clarity: the structure of a trade and how exactly to do it right.
This part you may feel that you have long understood, really to the real market, many people judge okay, the operation is distorted
We do not look at the pre-trading anomalies, do not chase the social hot post, we only pay attention to one thing: this transaction has formed a clear signal, is it worthwhile to do.
The focus is not to ask “it will not go up”, but to ask - “we have no logical reason to participate?”
What you will see next are the judgment processes we make in real trading:
From the structure began to start, to the price behavior confirmation;
from the system signal rating, to the capital flow to follow up.
Understanding is only the starting point, the real difficulty is that you dare not implement.
I will take you step by step to dismantle this set of logic:
From “this stock began to look different”, to “signal confirmation, can enter”, in the middle of what specific conditions to be verified.
Let's start with a few cases that we have just personally operated in July - the market hadn't noticed it yet, but the entry conditions were already clear, the price action was very clear - and we were the first to enter the market when most people didn't realize it. We were the first to get in when most people didn't realize it, and we were rewarded with outsized gains.
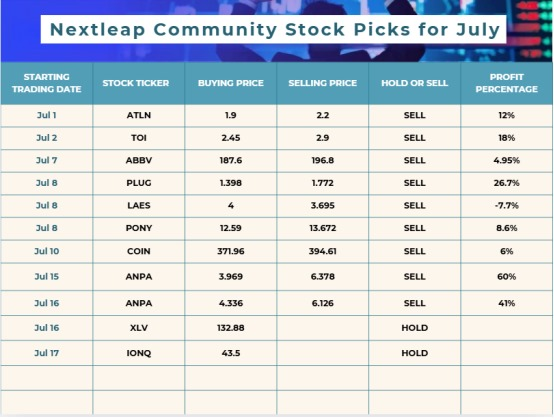
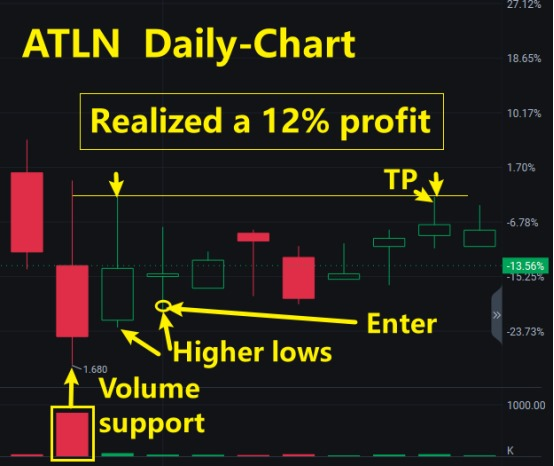
Observation Starting Point : June 27th|Position Opened : July 1st|Average Price of Position Opened : $1.90|Stop Loss : July 10th|Return : +12%.
Stage 1: Structure is forming, but the behavior is not yet complete
Starting from June 27th, I noticed that the price of $ATLN started to advance slowly along the upper edge of the previous consolidation zone, but the volume had already been enlarged, and there was no catalyst for the market to do anything about it. This was not a trading signal, but it was enough for me to put it on my watchlist.
At the time, the Core X quantitative trading system gave a status of “structural drift without confirmation” - the bottom structure was moving out of the concentration zone; the buying direction was slightly stronger, but not enough for a trend to form. The name was not yet on the market watch list;
The name is not yet on the market's watch list, but there is active buying.
I know: this state is not a buying point, but it's worth keeping an eye on.
Stage 2: Signal is clear, execution window opens
By July 1, behavioral indicators begin to strengthen in tandem:
Pending orders changed from symmetrical to biased buying, and active trading started to dominate the price move;
The breakout above yesterday's close did not continue higher, but is steadily consolidating - this is the type of setup preferred by the system.
The Core X quantitative trading system upgraded it to "early trigger candidate", marking it as a condition to open a position.
On that day we opened a position at a cost of $1.90 and set it up as a swing:
We are waiting for the price to move out of the bottom area with clear buying, not chasing short term swings that pull us up in a heartbeat!
Stage 3: Market continuity is confirmed and system signals are synchronized and strengthened
From July 2 to July 9, the trend is very clear:
prices moved steadily upwards without any significant retracement during the period;
daily volume was released steadily, with the dominant force coming from the active buyers;
the system maintained a high-confidence rating for six consecutive days without any reversal signals or risk alerts. The system has maintained a high-confidence rating for six consecutive days without any reversal signals or risk alerts.
This is a standard trend-following window. You don't need to predict the future at this point, you just need to hold until there are no destructive signals.
Stage 4: Reaching the expected zone, behavioral signals begin to weaken
By July 10, while prices were still pushing higher, two sets of key signals began to change:
Active buying decreased significantly, and deal density tended to decline;
Core X Quantitative Trading System lowered the behavioral score from “high” to " medium“ and removed the original ”reinforced flow" label.
For me, this means that active money is exiting and the next setup starts to become less predictable.
Therefore, I chose to exit intraday, locking in a +12% float. The entire trade followed the execution logic of the swing strategy from identification, entry, hold to exit.
The core of this trade is not how fast the reaction is, but whether each step is aligned with the signal:
On June 27th, we observed a potential setup forming, but the flow wasn't confirmed, so the system chose to wait and see;
On July 1st, the price and the behavior agreed, and the system marked clear trigger, execution of the position;
trend structure before the destruction of the continued holding, do not react prematurely;
behavior began to diverge from the initiative to exit, to cash the results.
The real execution is not to compete with who enters fast, but:
know when to enter dare to enter, when to leave the market can go.
Next we look at another underlying I've been involved in recently - $TOI.
It doesn't show up on mainstream watchlists and doesn't get much traffic, but also because no one is doing anything about it, the whole setup is much easier to read, and the behavior of the majors is clear.
This is my favorite type: price is just coming out of the consolidation zone, money is starting to show up, and sentiment hasn't stepped in yet.
I'll take you back to the scene of my thinking at the time:
What did I see? Why did I choose to enter in that position? And what was the signal that made me decide to leave the market?
This one, I actually did, step by step out of the deal, we look at it step by step.
$TOI: Not a hot ticket, but a clear and logical trade structure, the kind of setup our system is willing to take a shot at.
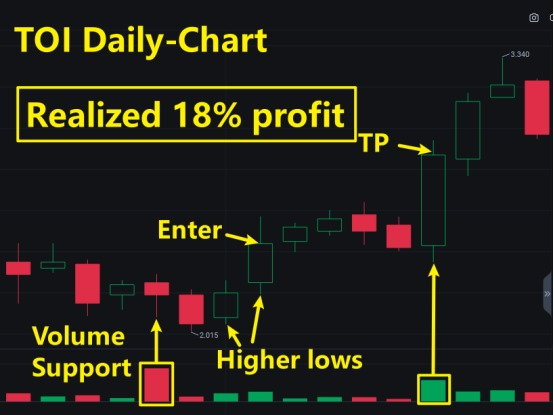
Observation Starting Point: July 1st|Build Position: July 2nd|Average Price: $2.14|Stop Limit: July 10th|Float Profit: +18
The cause was not news, but an undervalued structural opportunity
On July 1st, I noticed $TOI in a special position:
The previous sideways consolidation had just ended, and the price started to push along the upper rail, but there was no volume and no one was talking about it;
Intraday trading was not large, but the buy orders were hanging steady, and the trading was smooth, with no rush or emotional orders interfering.
The direction it was in wasn't the main line either - but that's exactly the type of thing I like.
More importantly, I went to look at its fundamentals and found a company with modest quarterly revenues, but a clear structure, well-controlled overhead, no deterioration in cash flow, and -
management had done a buyback statement in late May, suggesting that they were confident about second-half earnings.
This ticket wasn't a sprint type, but the trend was clear: the market had priced in this reversal early, and the fundamentals were still on the way.
I didn't get in right away, but the ticket started to show up on my watch list.
The next day, the signal triggered, the structure aligned, and the market gave an executable point to build a position.
During the July 2 session, I saw several things happen in tandem:
Price broke slightly above the previous platform high, but instead of pulling sharply, it held sideways at the high;
Active buyers began to dominate the time-sharing, and hanging single is a continuous plus, not one or two rushes;
volume did not get up, but the trend is very stable, there is no kind of a pull up and smashed back to the false action.
In my experience, this is the kind of “chips change hands just completed, the main force does not want to be found” trend.
I entered in the afternoon session, the average price of about $ 2.14, and at that time, I set up:
This trade does not chase the range, but can catch a complete release.
The next few trading days were the most comfortable time to hold the position!
Prices have been pushing up steadily since July 3rd:
No excessive intra-day swings or dramatic volume;
Every time it made a small step back it was bought back in time;
I looked at the brokerage report during the session, and although no one wrote about it, there was indeed a bit of money in the sector pre-layout.
I know in my heart that this trade was done right:
I didn't do it by guessing sentiment, but by capturing an opportunity that hadn't been disturbed by sentiment yet, but the fundamentals had just taken off and the money flow was becoming stable.
On July 10, I saw the active buying start to weaken and cashed out
During the July 10 session, the price was still rising but I noticed:
The upswing became slower and pending orders were no longer active;
Volume dropped significantly, and disk activity became lower;
I can see that the funds began to become cautious, not panic to leave the market, but the willingness to buy is decreasing.
It's clear to me:
I got into this ticket in the first place because it was just out of the structural zone;
Now it's time for me to go because it's already gone the way it's supposed to go.
We locked in a profit of +18% intraday. There was no chasing the highs, no emotion, and the execution was crisp and clean, and this confirmed setup was taken down in its entirety.
The key isn't how fast you react, it's how well you recognize the ticket that actually signals.
$TOI is not one of those sentiment-driven favorites, nor is it in the mainstream, and hardly anyone mentioned it.
But its setup is clear, the transaction has continuity, and the price itself gives confirmation.
Not by who is shouting, not by luck, the key is whether you read - the signal has been there.
What I see is:
a fundamentals have just improved, but the market has not yet recognized the subject;
a structure is about to be completed, but the mood has not yet kept up with the technical pattern;
a complete opportunity for me to enter the peace of mind, hold steady, and go logically.
Trading a lot of times, not because of who moves fast, but because of who see clearly, hold steady, and who performs well.
A trade like $TOI may not be hot or on the charts, but with clear signals and consistent execution, it can still give you a nice window to cash out.
The point is never to go up more, but rather: did you have the judgment, plan, and execution when it was time to get out.
Today we are talking about these two operations - $ ATLN and $ TOI - are not based on luck to step on the right rhythm, but the system identification + strategic judgment + stable implementation of the real trading opportunities.
We are not teaching you to guess the market, but to help you establish the logic of buying: signal recognition, position matching, entry time window of the three things of reaction.
These are not something that can be mastered by listening to it once, but are judgmental skills that are slowly built up in each real operation.
Alright, let's wrap it up here today. You have any concerns about individual stocks, unresolved judgment logic, can be raised at any time. We will continue to make it clear and understand in the next round of explanation.
In Palo Alto, California, in the little neighborhood where I used to stay, there used to be a used electronic parts store. The owner was a quiet old engineer who had a habit - every day before the store opened, he would sit at a small table in front of the door and tune an old radio, using the primitive dials to match the frequencies. He said, “You can never just rely on the automatic search to find the clearest channel, you've got to listen for yourself - to hear that position where there's no noise.”
That's a quote I've always remembered. Because the market is the same: no matter how advanced the system, no matter how popular the sector, no matter how intense the emotions, nothing can replace your “hand tuning” - the moment the signal confirms that you understand, the moment you decide to take the decision to take the shot you are responsible for it. Today we dismantle the $ATLN and $TOI, is this kind of “channel aligned” trade - not by heat, not betting on the trend, but by the signal, by judgment, by your willingness to believe in their own plans.
So, my friends, you don't have to take away your emotions today or rush to summarize how perfect it was.
You can turn off the charts and make a cup of coffee, or do what I did and flip back through your trading notes to see if your own strikes were right on judgment today.
That's the routine - keeping an eye on the market while training yourself to execute.
After making two combined 100% profits on $ANPA, I'm already planning what kind of short trip I'm going to take with my family this weekend.
Just a question for myself tonight: did I actually make a decision today when the signal was there?
Take care, folks, we're not trying to be right every day, we're trying to be worth it every time.
The next trade, it may not always be perfect, but it will always belong to the one who is ready.
See you tomorrow!